

Beautiful Clean Coal: Energy Transition’s Forgotten Fuel
The bull case for coal equities in 2026

Full Report: The complete write up is available in document format here.
Summarized Version is below.
The Contrarian Setup
Coal is the energy sector’s most hated asset class. ESG mandates have made it uninvestable for most institutional capital. Consensus expects secular decline.
And yet U.S. coal generation increased 11-13% in 2025. Natural gas prices have structurally shifted higher. Data center power demand is accelerating faster than renewables can build. The Trump administration has delivered the most coal-favorable regulatory environment in decades.
This isn’t a call for coal’s permanent renaissance. It’s a thesis that the market does not yet fully appreciate the catalysts that could drive significant outperformance in coal equities over the next 12-24 months.
The Investment Thesis
Core premise: Coal equities offer asymmetric risk/reward because:
Natural gas prices have structurally increased (LNG exports create floor), making coal competitive for power generation
Steel demand is strong (SLX ETF +46% YTD 2025), directly supporting met coal producers
Power demand is accelerating from AI/data centers faster than new generation can be built
Regulatory tailwinds from Trump EPA rollbacks extend operating life of existing plants
Valuations are depressed 4.1x EV/EBITDA despite improving fundamentals
Understanding the Two Coal Markets
This is crucial: thermal coal and metallurgical coal are completely different businesses with different demand drivers, different customers, and different price dynamics.
Thermal Coal (Power Generation)
End use: Electricity generation
Customers: Utilities, IPPs
Price driver: Natural gas prices (fuel switching threshold ~$3.50/MMBtu)
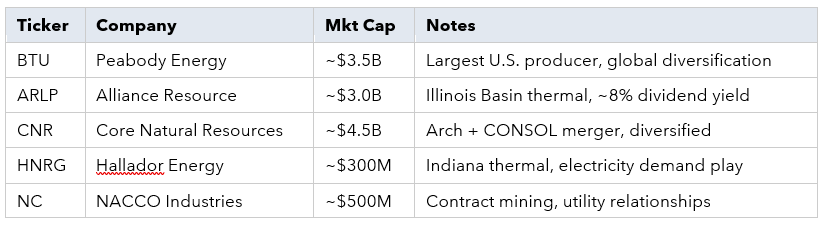
Key equities: ARLP, BTU, HNRG, NC
Metallurgical Coal (Steelmaking)
End use: Blast furnace steelmaking (irreplaceable for BF-BOF process)
Customers: Integrated steelmakers globally
Price driver: Steel demand, particularly from India and Asia
Key equities: HCC, AMR, METC
Understanding this distinction is essential for positioning. A rally in SLX (steel) benefits met coal producers. A spike in Henry Hub benefits thermal coal producers. Different trades.
The Natural Gas Connection
Here’s the mechanical relationship that drives thermal coal demand:
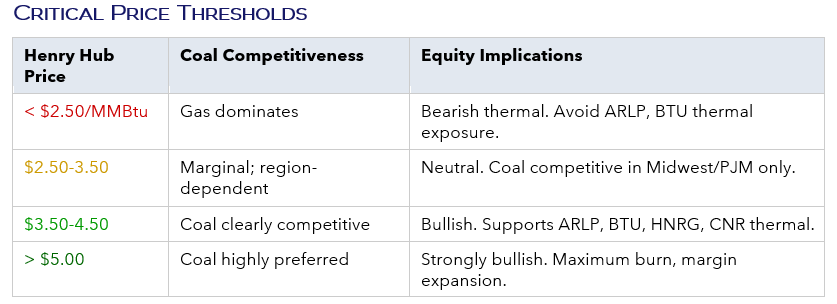
What happened in 2025: Henry Hub rose from ~$2.20/MMBtu (2024) to $4-5+/MMBtu. The EIA explicitly states: “Coal generation increased by 13% in 2025 due to more competitive fuel costs relative to natural gas.”
Why this is structural, not temporary: U.S. LNG exports increased 25% in 2025 to 14.9 Bcf/d, with another 10% growth expected in 2026. Plaquemines LNG and other Gulf Coast facilities are creating persistent demand for U.S. natural gas. The EIA projects Henry Hub to average ~$3.50/MMBtu in 2026 and $4.60/MMBtu in 2027—both levels supportive of coal generation.
The trading implication: Coal equity prices typically lag natural gas moves by 1-3 months. When Henry Hub spikes above $4/MMBtu, consider building thermal coal positions before the full earnings impact is recognized.
The Steel-Coal Nexus
For met coal producers, steel is everything.
Why steel demand = met coal demand:
70% of global steel is made via the blast furnace process
Every tonne of BF-BOF steel requires ~780 kg of metallurgical coal
There is no commercially viable substitute for coke in blast furnaces
Met coal serves as reducing agent, fuel source (~2000°C), carbon source, and structural bed
What SLX strength signals:
When the VanEck Steel ETF (SLX) rallies, it’s telling you:
Global industrial activity is recovering
Infrastructure spending is accelerating
BF utilization rates are rising
Met coal demand is increasing
The transmission mechanism: SLX tends to lead met coal equities by 1-3 months. If SLX rallies while HCC/AMR lag, that’s a catch-up opportunity.
Who Benefits Most from Steel Strength?
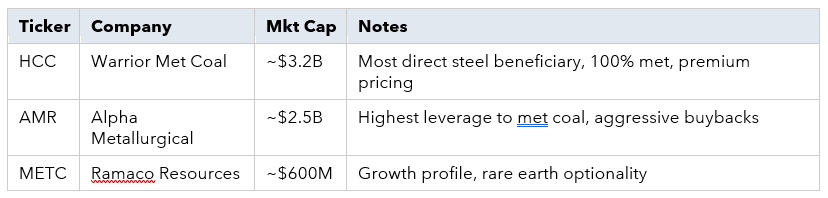
Tier 1 (Pure-Play Met Coal):
HCC (Warrior Met Coal): 100% met coal, exports to ArcelorMittal/Nippon Steel, most direct beneficiary
AMR (Alpha Metallurgical): 100% met coal, highest operating leverage, aggressive buybacks amplify per-share gains
Tier 2 (Significant Exposure):
METC (Ramaco): Met coal with growth profile, smaller scale but higher growth rate
CNR (Core Natural Resources): Arch + CONSOL merger, ~40% met coal exposure, owns Baltimore export terminal
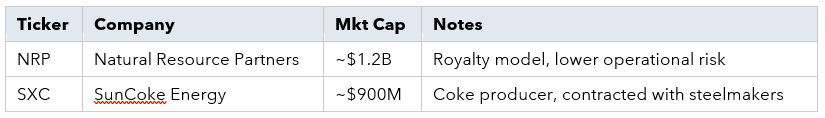
SXC (SunCoke): Coke producer with long-term take-or-pay contracts with integrated steelmakers
Tier 3 (Minimal Pass-Through):
ARLP, HNRG, NC—thermal producers with no met coal exposure; steel thesis doesn’t apply
The Political Landscape
The Trump administration has delivered substantial regulatory relief for coal. Here’s what’s happened and what it means for investors:
What’s Been Done
EPA proposed repealing all GHG emission standards for power plants
37% of U.S. coal capacity (~71 GW) received 2-year MATS exemptions through July 2029
Powder River Basin reopened to coal leasing
Coal designated as a “mineral” for permitting purposes
What’s Protected Through 2028
MATS exemptions extend to July 2029 regardless of elections
Once final rules are published, reversal requires 1-2 years of new rulemaking
Market forces (gas prices, power demand) operate independently of politics
What Could Change
2026 midterms: Democratic Congress could block further deregulation but can’t force new regulations
2028 election: New administration could begin rulemaking to reinstate standards (wouldn’t take effect until 2030+)
Courts: Environmental groups are challenging rollbacks; rulings expected 2026-2027
The Bottom Line on Politics
The American Action Forum concluded that Trump’s coal EOs are “unlikely to reverse the declining trajectory of U.S. coal production due to escalating mining costs, competition from other energy sources.”
This cuts both ways: Market forces drive coal demand more than EPA rules. Natural gas prices, power demand, and capital costs determine retirement decisions.
The Investable Universe
Pure-Play Met Coal (Steel Correlation)
Thermal/Diversified (Power Generation)
Royalty/Specialty
ETF Option - COAL Range Global Coal Index
Key Monitoring Indicators
Price Signals
Henry Hub Natural Gas: Critical threshold at $3.50/MMBtu
Australian Hard Coking Coal (HCC Index): Global met coal benchmark
SLX performance: Leading indicator for met coal equities
Demand Indicators
EIA Weekly Coal Production: Tracks production trends
Utility Coal Stockpiles: High stocks (>120 MMst) bearish; drawdowns bullish
Coal’s Share of Generation: Track via EIA Electricity Monthly Update
Political Calendar
Early 2026: EPA expected to finalize GHG standard repeal
November 2026: Midterm elections
July 2029: MATS exemptions expire
The Risk Case
What could break this thesis:
Natural gas collapses below $2.50/MMBtu for extended period (thermal coal thesis dies)
Global recession tanks steel demand (met coal thesis dies)
Utility retirements accelerate despite economics (structural headwind)
Court rulings invalidate EPA rollbacks (headline risk, but long implementation timeline)
Liquidity risk: Coal equities trade with lower volume than major energy names
Bottom Line
Coal isn’t coming back as a growth industry. The secular decline is real. But markets can be wrong about timing and magnitude.
The setup today:
Structural support from LNG-driven natural gas prices
Strong steel demand supporting met coal
Regulatory tailwinds extending plant lives
Depressed valuations with negative sentiment
This is a contrarian, cyclical trade—not a buy-and-hold forever position. The catalysts are in place for a period of outperformance.
What are your thoughts? Reply to this email or leave a comment below. Be sure to join the subscriber chat for additional updates.
