

[Not Your Economist’s] 2023 Outlook

A few weeks ago I wrote a post making the case for an allocation to gold that also touched on a few other areas of the current macro picture. This piece elaborates on that macro view further, combats a few common market narratives you may see in upcoming ‘2023 Outlook’ reports and looks ahead to what is next. NFA.
The TLDR?
Just like in 2020 and 2021 when no one saw inflation coming despite extreme fiscal stimulus, I think the reverse is true today. The Fed is on a warpath to deflation at a maximum, severe disinflation at a minimum. The impending recession will rival some of the largest in recent history and will stifle economic demand and inflation along with it. Once realized by central banks and governments around the world, it will be too late. 2023 will be another very troubled year for risk assets. What happens after that? We’ll see but a good hunch is something like even bigger central bank QE and fiscal spending that could actually this time around kick off a real long-term inflationary regime. This could look like all the things we’re getting a taste of now, just on a larger scale - worsened infrastructure and supply chains, underinvestment in commodities and the reverse of globalization/broader geopolitical forces. The manic behavior by central banks around the world will continue to come into question as the fishtailing from side to side becomes more severe. But that’s all a bit down the road - this piece focuses on more actionable ideas in the next 3-6 months.
Contents
The global recession ticket is punched - the question remaining of how long/severe hinges on how long it takes for the Fed to break something in the markets
The Fed is fighting other people’s battles against goods and services inflation - QE and CPI inflation are largely unrelated
The dollar’s relative strength or weakness is less important than your local dollar milkshake theorist would lead you to believe
What to watch for next and how to position
1. The global recession ticket is punched - the question remaining of how long/severe hinges on how long it takes for the Fed to break something in the markets
The following thread from Jeffrey Gundlach and the DoubleLine team is a great summary.

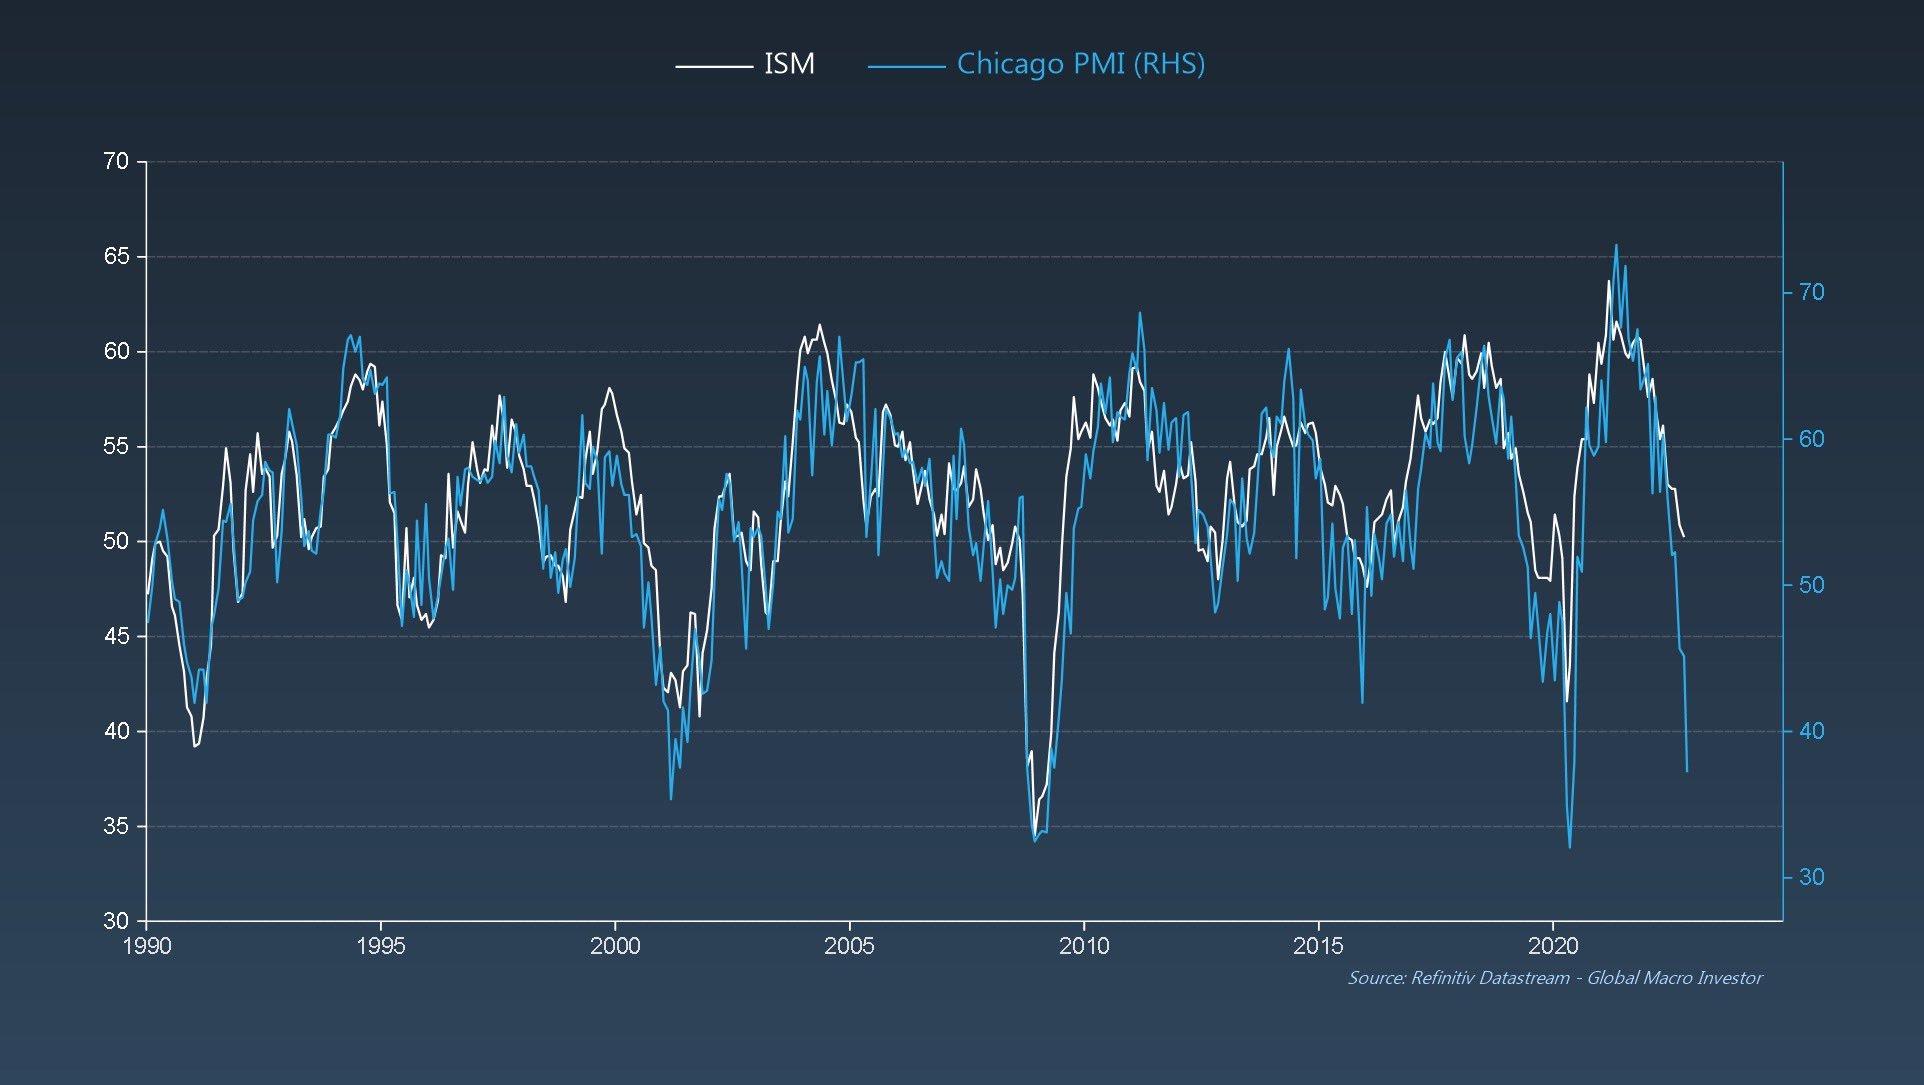
US leading economic indicators, ISM and PMI’s, housing have all significantly rolled over
And despite all of the data above, the Fed is increasing its restrictive stance with a 75 bps rate hike in November and another 50 bps expected this week in December. This is significantly different from historical periods that have flashed this many recession signals because in those the Fed had already paused AND even started cutting rates 6-12+ months prior.
Knowing the Fed’s reversal is a question of ‘when’, not ‘if’, the market has remained steadfast in its attempt to shortcut, thus keeping risk assets somewhat bolstered (yes equities are down tremendously, however it has been extremely orderly). The market is saying “I have learned my lesson - there’s a reason ‘the third time’s a charm’ is a saying. In this case, after repeated Fed pauses and significant pivots over the last decade (2020, 2019, 2018, 2016), the Fed put has finally been drilled home. And the economic picture is becoming dire, so the market has been saying ‘the Fed will pivot and I will front run it”. Unfortunately it’s a reflexive loop that can’t be shortcut - it’s almost as if we’re watching a car crash in slow motion.
So when will the Fed pause and/or pivot?Let’s start with Powell’s recent communications:
November 2nd Fed Meeting
"The historical record cautions strongly against prematurely loosening policy. We will stay the course until the job is done.”
“If we were to overtighten, we could then use our tools strongly to support the economy, whereas if we don’t get inflation under control because we don’t tighten enough, now we’re in a situation where inflation will become entrenched and the costs, the employment costs in particular, will be much higher potentially. So from a risk management standpoint, we want to be sure that we don’t make the mistake of either failing to tighten enough or loosening policy too soon.”
November 30 Brookings Speech
“The report must begin by acknowledging the reality that inflation remains far too high”
“As our last postmeeting statement indicates, we anticipate that ongoing increases will be appropriate. It seems to me likely that the ultimate level of rates will need to be somewhat higher than thought at the time of the September meeting and Summary of Economic Projections.”
“Given our progress in tightening policy, the timing of that moderation is far less significant than the questions of how much further we will need to raise rates to control inflation, and the length of time it will be necessary to hold policy at a restrictive level. It is likely that restoring price stability will require holding policy at a restrictive level for some time. History cautions strongly against prematurely loosening policy. We will stay the course until the job is done.”
December 14 Fed Meeting
“Reducing inflation is likely to require a sustained period of below-trend growth and some softening of labor market conditions. Restoring price stability is essential to set the stage for achieving maximum employment and stable prices over the long run. The historical record cautions strongly against prematurely loosening policy. We will stay the course until the job is done.”
“19 people filled out the SEP this time, and 17 of those 19 wrote down a peak rate of 5 percent or more, in the 5s. So that’s our best assessment today for what we think the peak rate will be.”
“As just a matter of practice, the SEP reflects any data that comes out during the meeting. And participants know that they have the—they know this, that they can make changes to their SEP during the meeting, you know, well in advance of the press conference, so that we’re not running around. But that’s not the case. It’s never the case that the SEPs don’t reflect an important piece of data that came in on the first day of the meeting.”
All Fed guidance to date points to over-tightening in the name of ‘inflation risk-management’. It’s extremely evident that the Fed believes in erring on the restrictive side of policy to ensure they bring inflation down. Another interesting tidbit I recently came across in a 2009 Alan Greenspan interview which is part of a 2013 oral history project conducted by the Fed (quite entertaining reading actually).
INTERVIEWER: What is the value-added of the FOMC, given what you have just said about how difficult the job of forecasting is?
MR. GREENSPAN: Basically, you don’t always have to, and shouldn’t, respond at the first sign of a recession. For example, in the year 2000, after we had the dot-com bubble, we were aware that the economy was weakening, and, in fact, bond yields were falling very significantly. We decided to hold policy unchanged until the early days of 2001, after the recession had been under way for quite a while, to make certain that we did not reverse or abort the diffusion of the bubble. That sort of judgment is relevant to what one knows about the economy. While it is the case that it would be useful to move policy in advance, it’s not evident that it makes a huge difference. Most of the policy decisions we made related to how you handled what was happening at any particular point in time, and there, I think, the Board did rather well.
The other point I’d just highlight is to keep in mind the drastic shifts in government’s COVID response, monetary policy changes and subsequent economic data. Remember how annoying the word ‘unprecedented’ became throughout 2020? The increased speed and magnitude of monetary and fiscal manipulation has forced the Fed to repeat that in the opposite direction. Additionally, the increased difficulty in projecting expected impact and associated timing lags have proven to be problematic for market participants to assess. This has been noted by Powell himself, was made evident by the ‘transitory’ inflation overshoot on the way up and will most likely be the case on the way down. If you’re questioning if the whole economy is simply at the whim of the Fed then trust your gut and mark one down in the loss column for Adam Smith’s invisible hand.
2. The Fed is fighting other people’s battles against goods and services inflation - QE and CPI inflation are largely unrelated
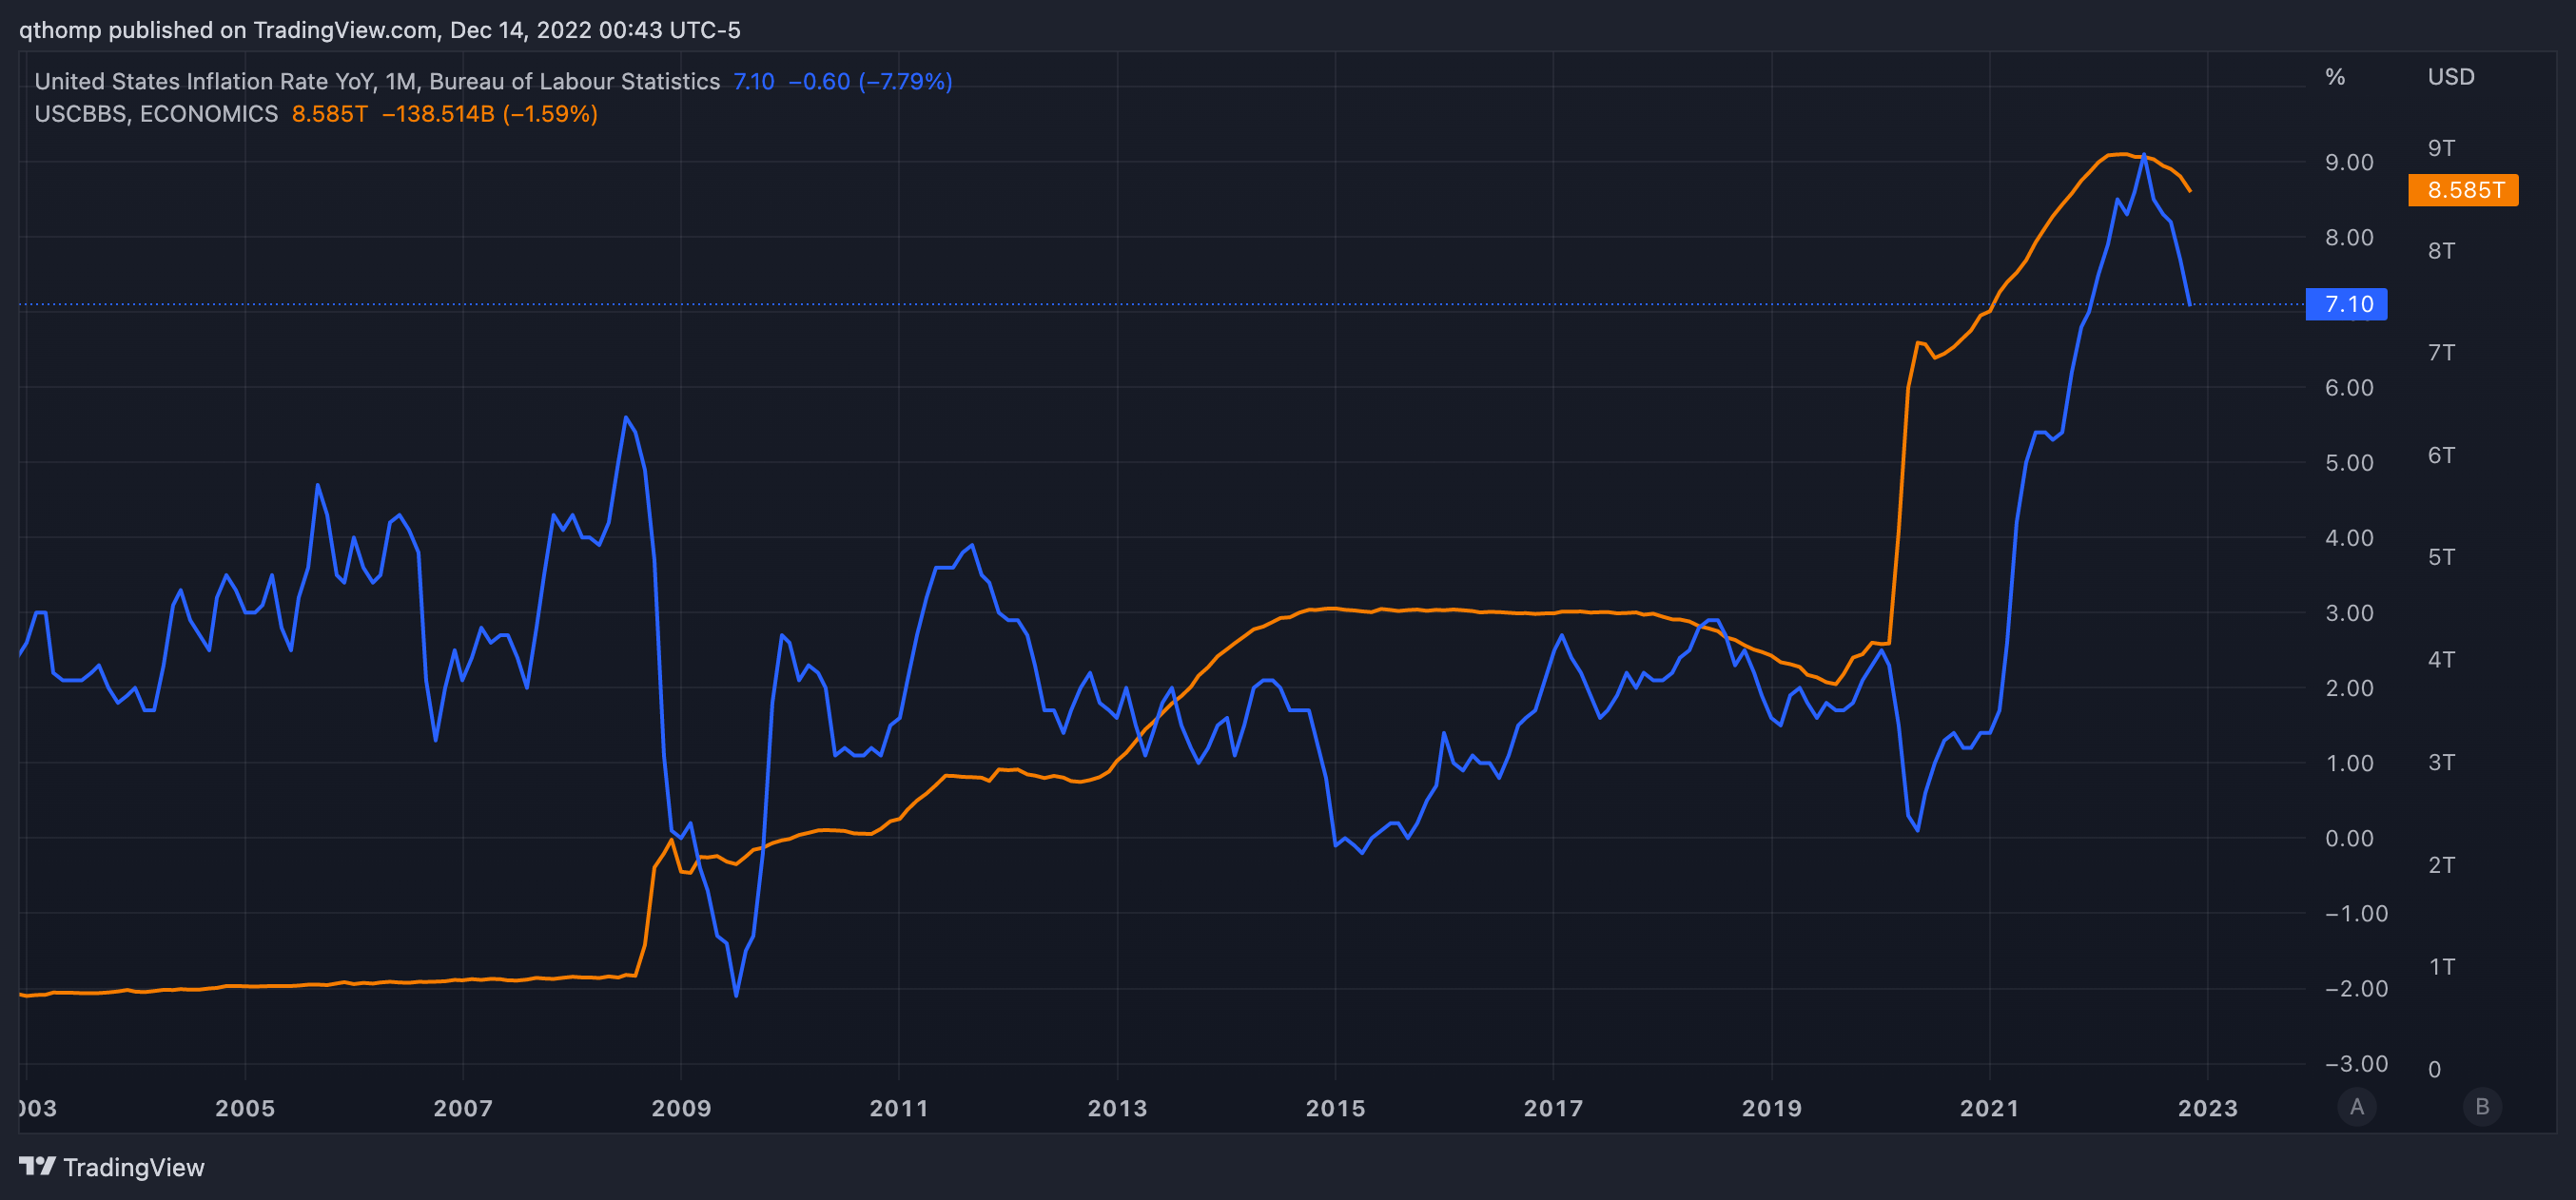
So for starters, the Fed’s balance sheet went from $0 to $4.5 trillion from 2009-2015 and didn’t cause any meaningful CPI increases. This has also been the case globally across Japan and Europe after decades of QE. As the chart below shows with CPI (blue) vs. Fed balance sheet (orange), 2020-2022 was a very different outcome.
Introduce - the supply shock. At the onset of COVID, essentially all manufacturing and supply chains were shut in. Globally. Rolling shut downs lasted for well over a year in most places. The world saw the largest coordinated supply shutdown maybe ever.
On top of that, there went the stimulus. Now after Bush’s 2008 cash rebates we also saw a slight uptick in inflation, however the 2020 COVID stimulus made those look like preschool. Try three rounds of checks totaling $3,200 plus added unemployment benefits that paid 50% of people more than their previous jobs were! This caused consumers (~70% of US GDP) to maintain spending and ordering of goods and services when the factories were actually closed. So to solve this, you need increasing prices to help bring supply and demand back in line until equilibrium is met.
Thus it’s important to distinguish the difference between goods and services inflation versus asset price inflation. Historically, inflation has largely been discussed in relation to the prices of goods and services, or CPI, however QE has only caused asset price inflation, not goods and services. Central bank quantitative easing and CPI inflation are largely unrelated. And that remains the case today, with the difference this go around being the fiscally induced demand pull in the midst of the worst global supply chain environment potentially ever.
To elaborate further, Fed QE and balance sheet expansion artificially reduces interest rates and the cost of money. The excess reserves that are built up are not being lent out in earnest, stimulating spending or consumer animal spirits, but rather lowing the risk free rate and remaining idle on bank’s balance sheets. Because of reduced interest rates, the cost of all kinds of leverage is reduced - corporate, sovereign, personal etc. and creates a highly financialized economy. The consequence is the inflation of whatever that leverage is used for, which are financial assets (not goods and services). With government debt to GDP at 130%+ levels and total debt to GDP multiples of that (inclusive of the private sector), that leverage has gone into risk assets. Whether it be the private equity, private debt, venture capital or pension funds taking on that risk into private, public or startup businesses - it’s all the same. Where the risk taking has left the big banks, it has not gone away but instead grown and housed elsewhere in the financial system. The lower the cost of capital, the cheaper money is - in some cases around the globe it was free - and so it’s easy to see why more speculative investments increase. These features are why, despite Powell on primetime TV telling the American people they ‘print money’, the Fed’s actions are in part to blame for the rampant wealth inequality, but the Fed is not to blame for the current CPI increases.
And so what we are seeing today with aggressive QT is the opposite effect and the destruction of that money. Despite the Fed not starting the CPI inflation problem, they have tasked themselves with trying to fix it. So how to do this? Well they can’t pump more oil or produce more agriculture. What they can do though is inflict enough financial pain on consumers that stymies demand and brings it down to equilibrium with supply. And we’re seeing this today - when the Fed is increasing the cost of money and decreasing its availability, leverage is evaporated and financing consolidates closer and closer to the core necessities, with less importance on speculative investment. This is why the popping of asset bubbles start with tech, crypto and long duration 30 year bonds. If continued it eventually leads to other more liquid risk assets like equities and high yield credit and then eventually commodities and all assets. For reference, there was a point this year where long duration US treasury bonds were down 35%+, acting similar to other long duration assets like crypto and tech. We’ve seen liquidity episodes in UK gilts, tech and crypto, however the true liquidity crunch of this cycle has not yet occurred.
The reflexive obstacle mentioned above that markets are facing has created a game of chicken. The market’s Fed pivot hopium reflates assets, forcing additional Fed hawkishness, rinse and repeat. And the longer the Fed keeps front end rates high, the lower back end rates can go because it means they’re going to kill demand to kill inflation. I’m as big of an oil bull as you’re gonna find but there comes a point where QT causes enough demand destruction to break its back in the short term.
Two of the core challenges to the Fed’s approach here.
Given many of the structural supply issues like in oil and commodities are not being addressed, what happens if the demand reduction doesn’t ever go below supply equilibrium at these prices?
This could pose a very large problem for central banks as investment in commodity production around the world continues to be neglected in the name of ESG. This is a much longer discussion, but to summarize - in economic downturns oil prices tend to be the ‘release valve’ I’ll call it. Basically when demand plummets and creates excess supply, there’s downward pressure on prices which usually breaks down pretty significantly. This short-term ‘release valve’ helps balance markets as lower prices cushion lower incomes and allow real spending to maintain and eventually rebound. Well what happens when there is not enough reprieve in prices? Think of it like a UFC fighter that taps out but the chokehold isn’t released. If the economy and consumption is not aided by lower prices, the pain will be worsened.
Given US tax revenues and budget deficits are directly tied to asset prices and incomes, what happens when the US has to operate at ever larger deficits and finance those with additional debt issuance?
This is a problem over the long-term but can often be punted far enough down the road. When push comes to shove, the debt ceiling will be raised, the deficits will be financed and the Fed will increase the size of its balance sheet. Eventually though, you’d think this will become quite a big problem. We’re already seeing this play out actually today. The Fed is now paying out interest at 4.25-4.50% and its expenses are vastly exceeding its revenues, forcing it to increase the size of its balance sheet.
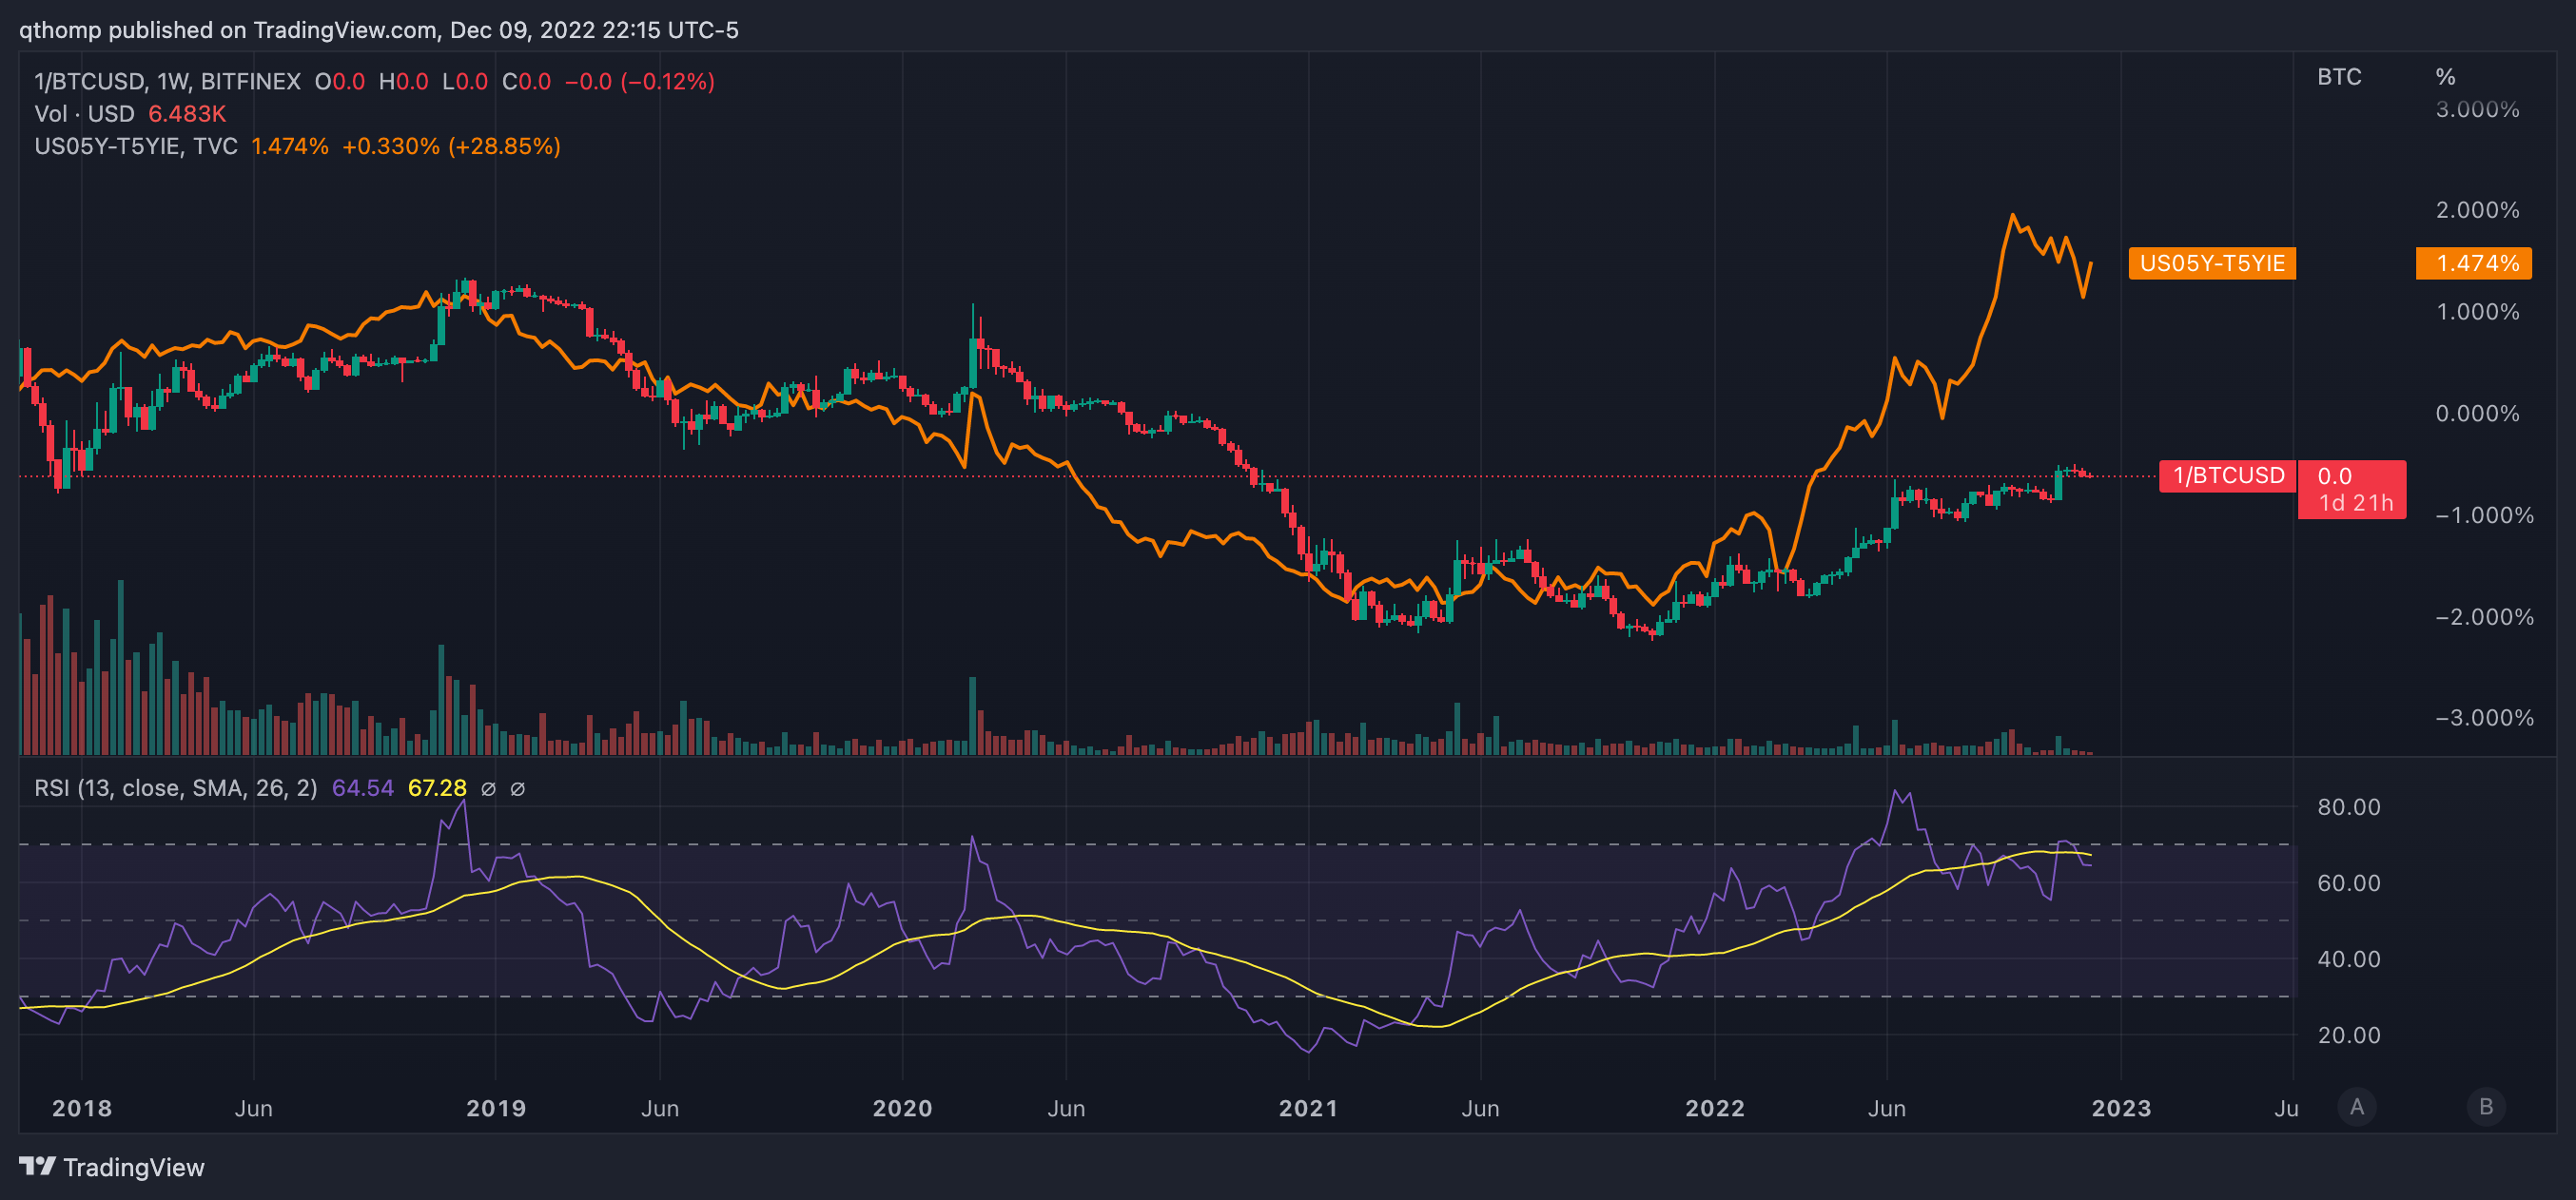
If there’s one chart to look at in this whole piece, it might be this one. The inverted price of Bitcoin (candles) vs. US 5Y real rates (orange) show a near perfect correlation. The significant 0.8-1.0 historical correlation highlights the close association between falling real rates (indicative of QE) and rising Bitcoin prices, and vice versa. Bitcoin is a phenomenal asset price inflation hedge - what the Fed causes via QE (largely unrelated to CPI inflation).
3. The dollar’s relative strength or weakness is less important than your local dollar milkshake theorist would lead you to believe
I think the ‘dollar milkshake theory’ is vastly overemphasized. While I agree with some of the logic around US capital inflows and dollar strength over time, it’s 100% relative to the country or currency in comparison. And if you assume the US will comprise an ever decreasing percentage of global GDP as the world’s populations and economies grow, the dollar would then by definition also become less relevant on a global scale. Although I do expect the dollar to continue outperforming at a reasonable pace versus many developed nations like Europe and Japan, say a rate approximately equal to relative annual GDP outperformance, it is all completely relative and dependent on the other country or currency in comparison. And the assumptions underpinning complete and total dollar dominance would only be possible in a system where everything flowed through the US.
Although the world is de-globalizing in some senses of the word, like moving to more regional supply chains, in many other ways the world is becoming increasingly connected. Some examples include the move to global remote workforces, annual cross border payment volumes consistently increasing and improved access to education in developing nations increases economic growth rates relative to developed nations, thereby making them more attractive places for investment. On top of that, sovereign nations are seeking alternate “store of value” assets to mitigate their reliance on external geopolitical actors. This can be seen via central banks’ increased purchases of gold, trade deals priced in local currencies and the more nascent adoption of cryptocurrencies. In the US (and even much of the world today), those assets like gold, oil and cryptocurrencies are priced in dollar terms, but that is also changing as more trading pairs and on-ramps are being spun up for their exchange outside of the US.
It’s important to view the dollar’s ‘price’ similarly to how you would view say the price of ETH vs. the price of BTC, or the price of Apple vs. the price of Microsoft - on a relative basis within that asset. And more broadly, yes if capital is flowing out of digital assets, both ETH and BTC will perform poorly, however their relative performance to each other is a different story.
I believe the more important takeaway to be - all central banks are printing their respective fiat currencies without regard and all fiat currencies are performing poorly versus valuable assets. However, the ebbs and flows of the dollar’s strength versus other fiat currencies are dependent on relative near-term economic strength (and along with that, level of monetary expansion). In the case of recent USD weakness, I believe it’s because in the same way rising commodity prices hurt RoW more than US (higher inflation, lower growth), falling commodity prices are helping RoW more than US. Additionally, the quicker demand falls (indicated by oil price), the quicker the Fed will reduce its relative hawkishness vs. RoW central banks. It’s slightly reflexive as well because as the USD rises vs. RoW, it is exporting inflation, weakening them further, so I expect a similar theme to play out in this opposite direction. This also explains the unusual positive correlation witnessed with DXY and WTI.
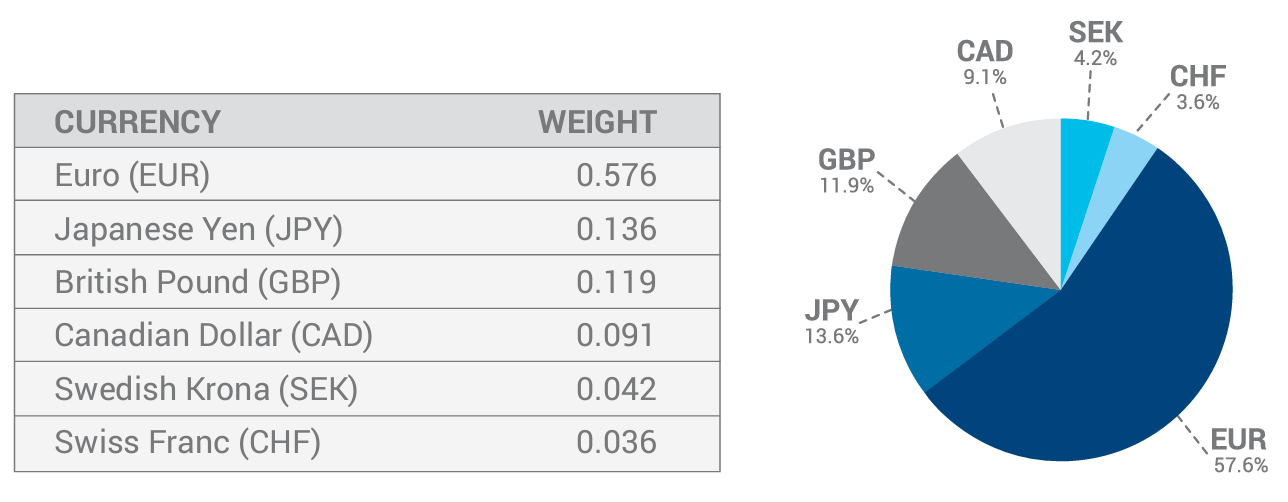
For the reasons cited by the dollar milkshake theory’s proponents, I do believe the US will be a net beneficiary of capital investment versus most of the world over time, however I’m not sure it ends in the same type of destruction. As an aside - watching the commonly cited dollar index as a proxy for all of this may be misguided. Do you know what makes up the DXY index? It excludes two of the world’s six largest economies (China and India).
Anyways, to best summarize a few of the above points - I’ve plotted the DXY (candles) vs. Gold (yellow) and Oil (blue), along with their correlations below. Notice the gradual deterioration in DXY vs. Gold correlations since the GFC, and more recently since 2018 for the DXY vs. Oil. I think this is a factor of both 1) the DXY becoming a worse measure of the dollar’s global value because it excludes multiple relevant currencies and 2) more global economic activity happening away from the dollar and reducing its cross-asset impact.
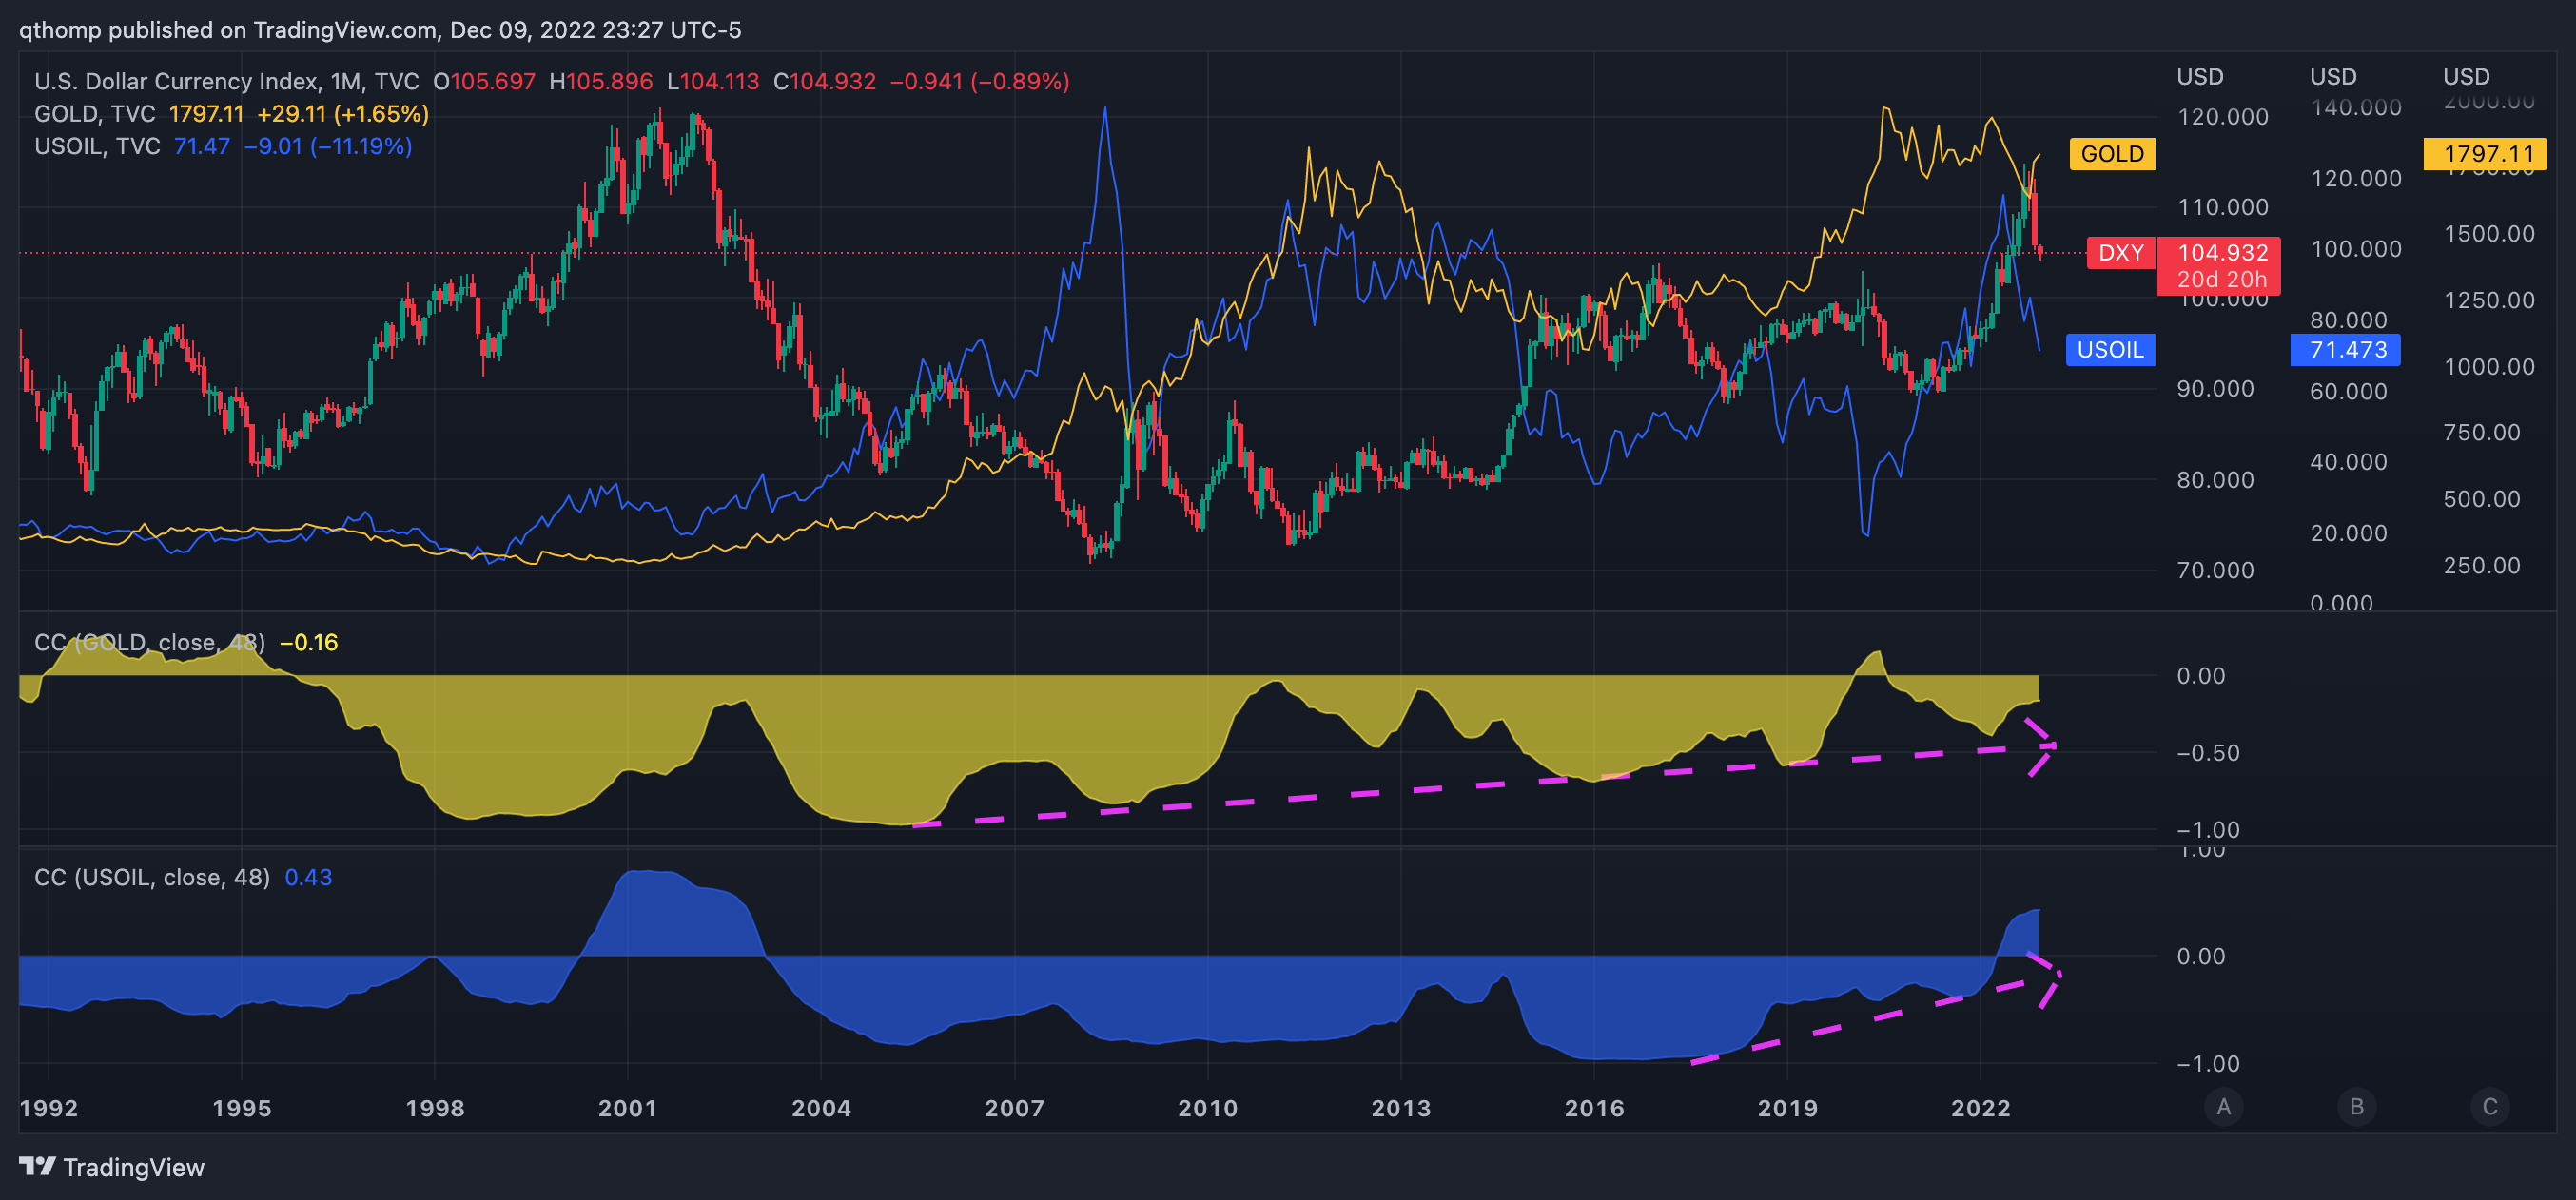
To conclude, I too believe the dollar will outperform most major global currencies over time as it is the best smelling pile of garbage but that this metric is less relevant than people make it out to be.
4. What to watch for next and how to position yourself
Let’s start by addressing a few of the common narratives floating around.
M2 growth / decline has reached previous bottoms so risk assets are a buy.
False - we are in a seriously different market structure today. The Fed has never been hiking/removing liquidity at this pace and at this late in the business cycle. The reason for this is their focus on goods and services inflation (which they largely don’t control) and this is what drastically differentiates this cycle from its predecessors. M2 growth is negative and is at the lowest YoY rate in many decades, but can continue - until markets break that is.
Oil supply is so tight that prices cannot go any lower.
False - it’s a physical market and where spot clears in the immediate-term can vary widely from the term structure. In times of economic distress, short-term demand ALWAYS wins out vs. supply because inventory needs to be physically offloaded, and this time is proving to be no different. The market has already defied the Saudi’s $90 production cut line in the sand and is about to defy Biden’s $70 SPR put. And in the same way that SPR releases didn’t stop oil’s rally earlier this year, SPR purchases are unlikely to do much to buoy in the near-term.
Inflation has peaked, the Fed must pivot.
False - we are in a seriously different market structure today due to goods and services inflation. In fact, every time markets rear their heads on the back of a potential pause or pivot, financial conditions ease and reflate against the Fed’s goals. Total demand destruction or enough demand destruction that would give the Fed an out is what it will take to pivot.
Bitcoin/crypto is a bad inflation hedge.
False - the Fed and other global central banks’ easy monetary policies over the last few decades has resulted in massive asset price inflation, not goods and services CPI inflation. This holds true in the most recent episode as well, but goods and services inflation also arose due to aggressive fiscal stimulus in the face of a ruptured supply picture (globally coordinated shut downs). Bitcoin and crypto are actually perfect asset price inflation hedges, which can most easily be measured by real interest rates.
The dollar milkshake theory rules all
False - although a catchy narrative, the heavily overused dollar milkshake theory describes a phenomena that would take ages to play out, has proven to be irrelevant in the short-term and would require a world that becomes more US-centric, not less.
So what’s next and how to position?
Inflation has undoubtedly peaked, however due to the Fed’s focus on CPI inflation it remains focused on QT and rate hikes in order to bring down demand. 2022 has seen the most rapid and largest rate hikes in recent history while being conducted the latest they ever have been into a retracting economy. As explained above, the global economy is already in a synchronized recession and headed for an even worse one. Past cycles show that the downward inertia becomes overpowering, even after Fed pauses and begins cutting rates.
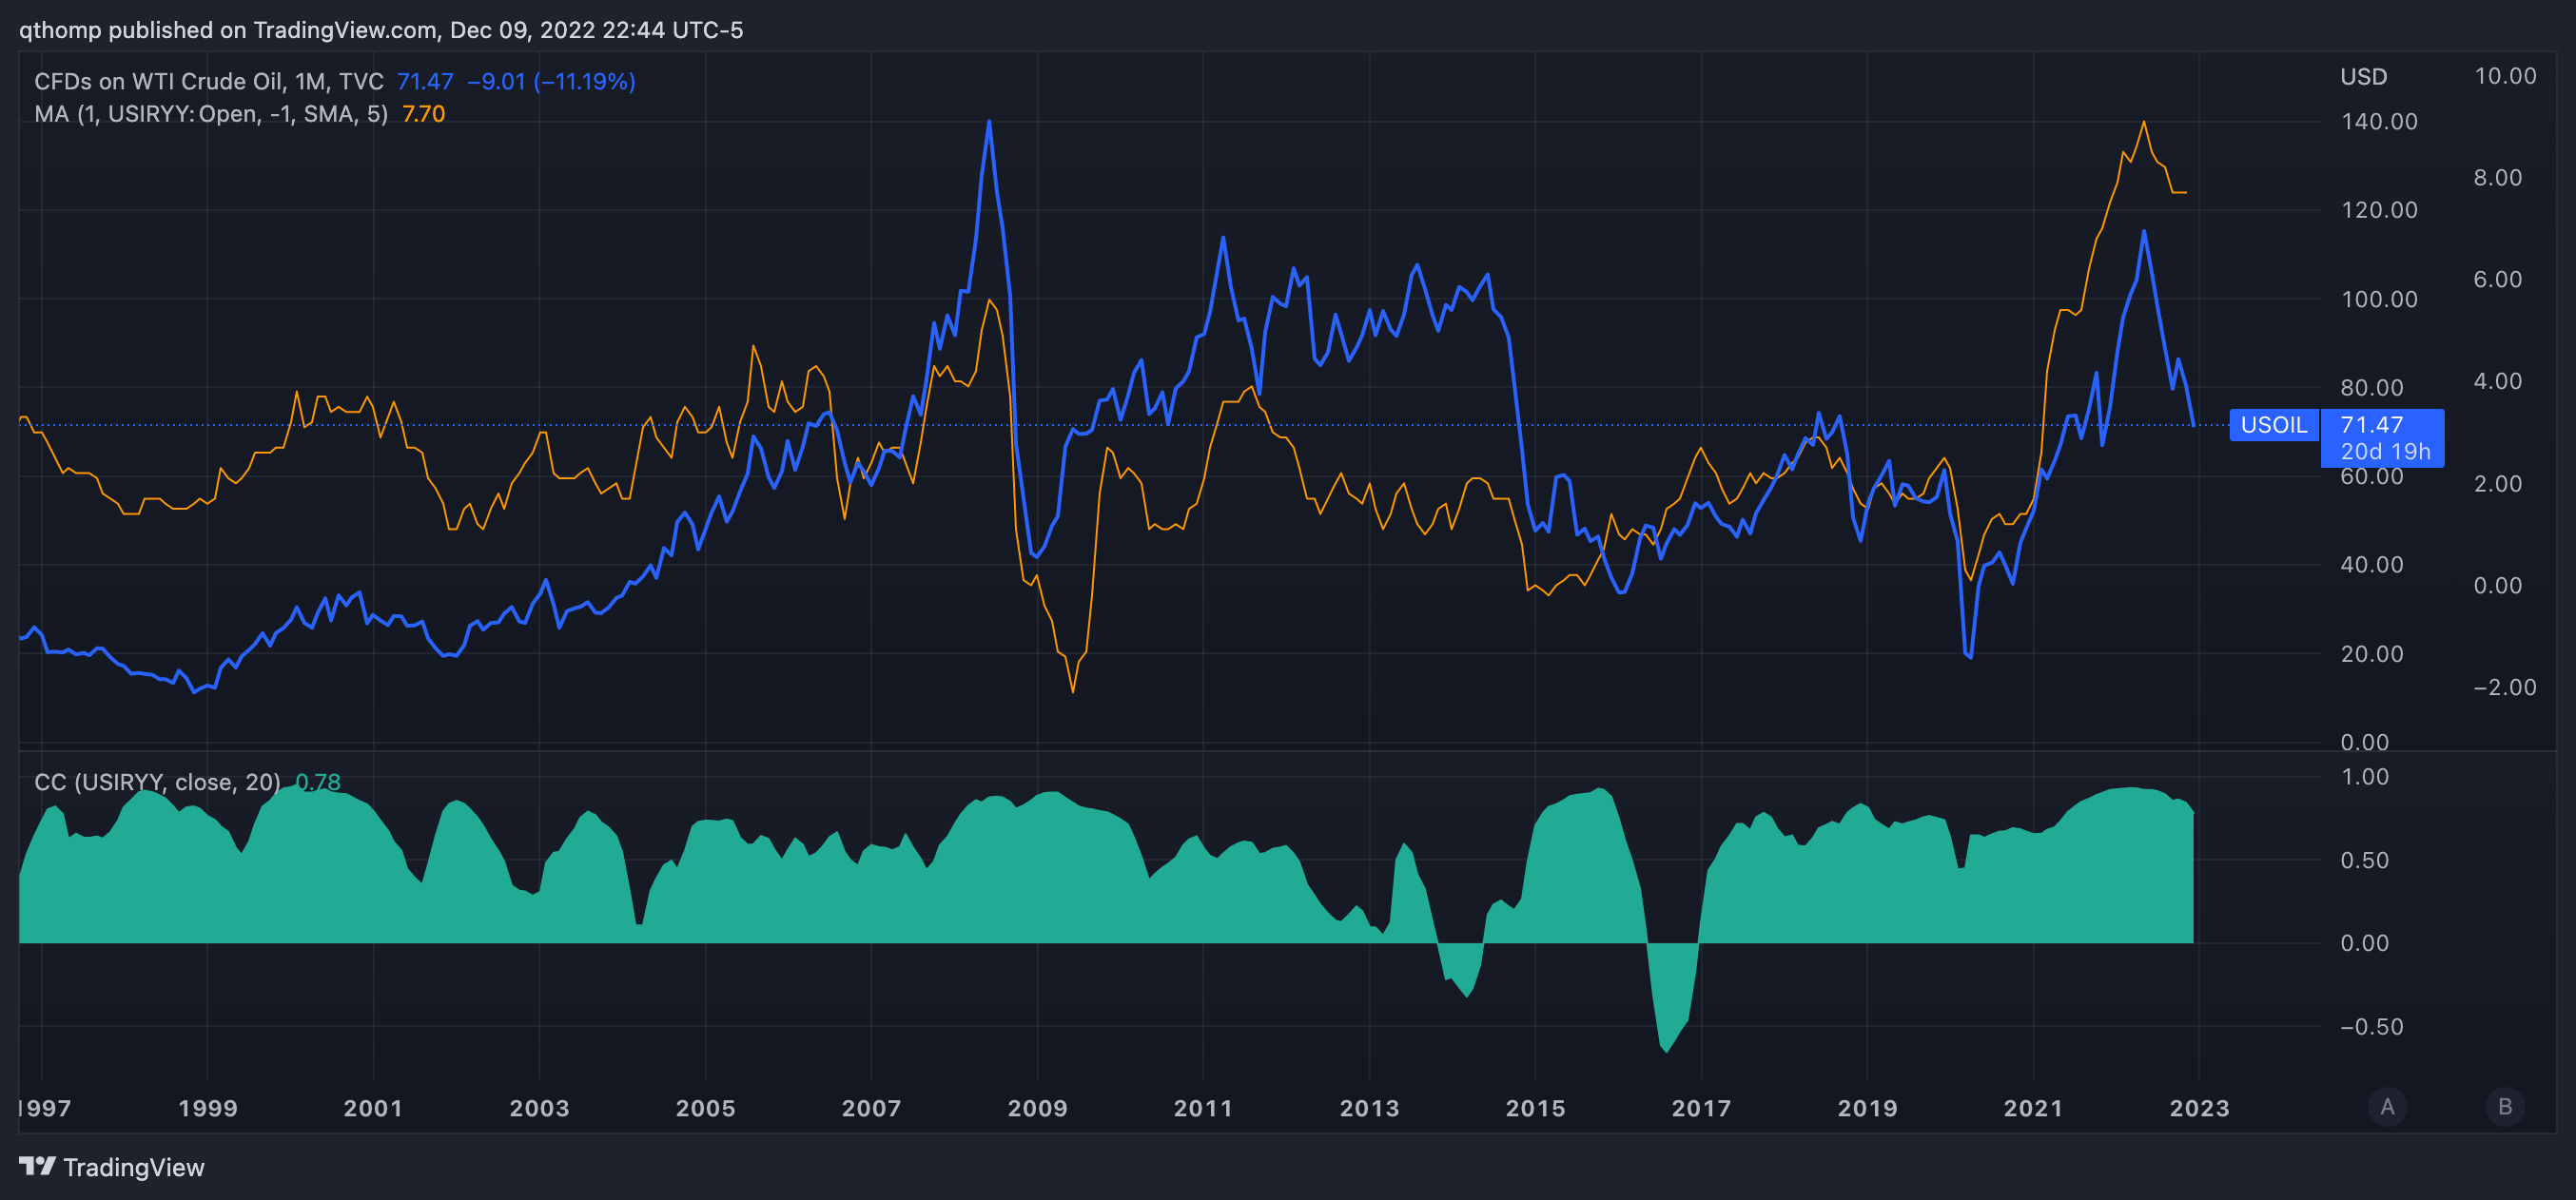
In addition, inflation is not only rolling over, but about to round trip express back towards where it started. 1 month lagged US YoY inflation (orange) plotted against WTI (blue) shows a few things. Firstly, the two have moved with a 0.65-0.95 correlation coefficient (significant) since 2017 and secondly, oil is -11% MTD in December, signaling another lower CPI print on the horizon.
So economy lower, inflation lower - but what does that mean for interest rates and liquidity? Specifically real interest rates are the big kahuna. As highlighted in Section 3 above, if you figure this out, you figure everything out. To refresh - in their simplest form, real interest rates can be understood as nominal interest rates less inflation - whereby a positive number means rates > inflation, and a negative number vice versa. The trend here is more important than the number itself. For risk assets to see support, real interest rates need to drop.
The question to ask is - which falls faster, interest rates or inflation expectations? There is also the question of tenor. For the purposes of this discussion, when referring to real rates I will mean 5-10 years out as the term structure can vary quite widely in shorter time horizons.
The below chart is busy buy bear with me. Top pane shows US 5Y yields (candles) vs. US 5Y inflation expectations (blue). Middle pane is US 5Y real rates (orange) and bottom pane is the spread between CPI and 5Y inflation expectations.
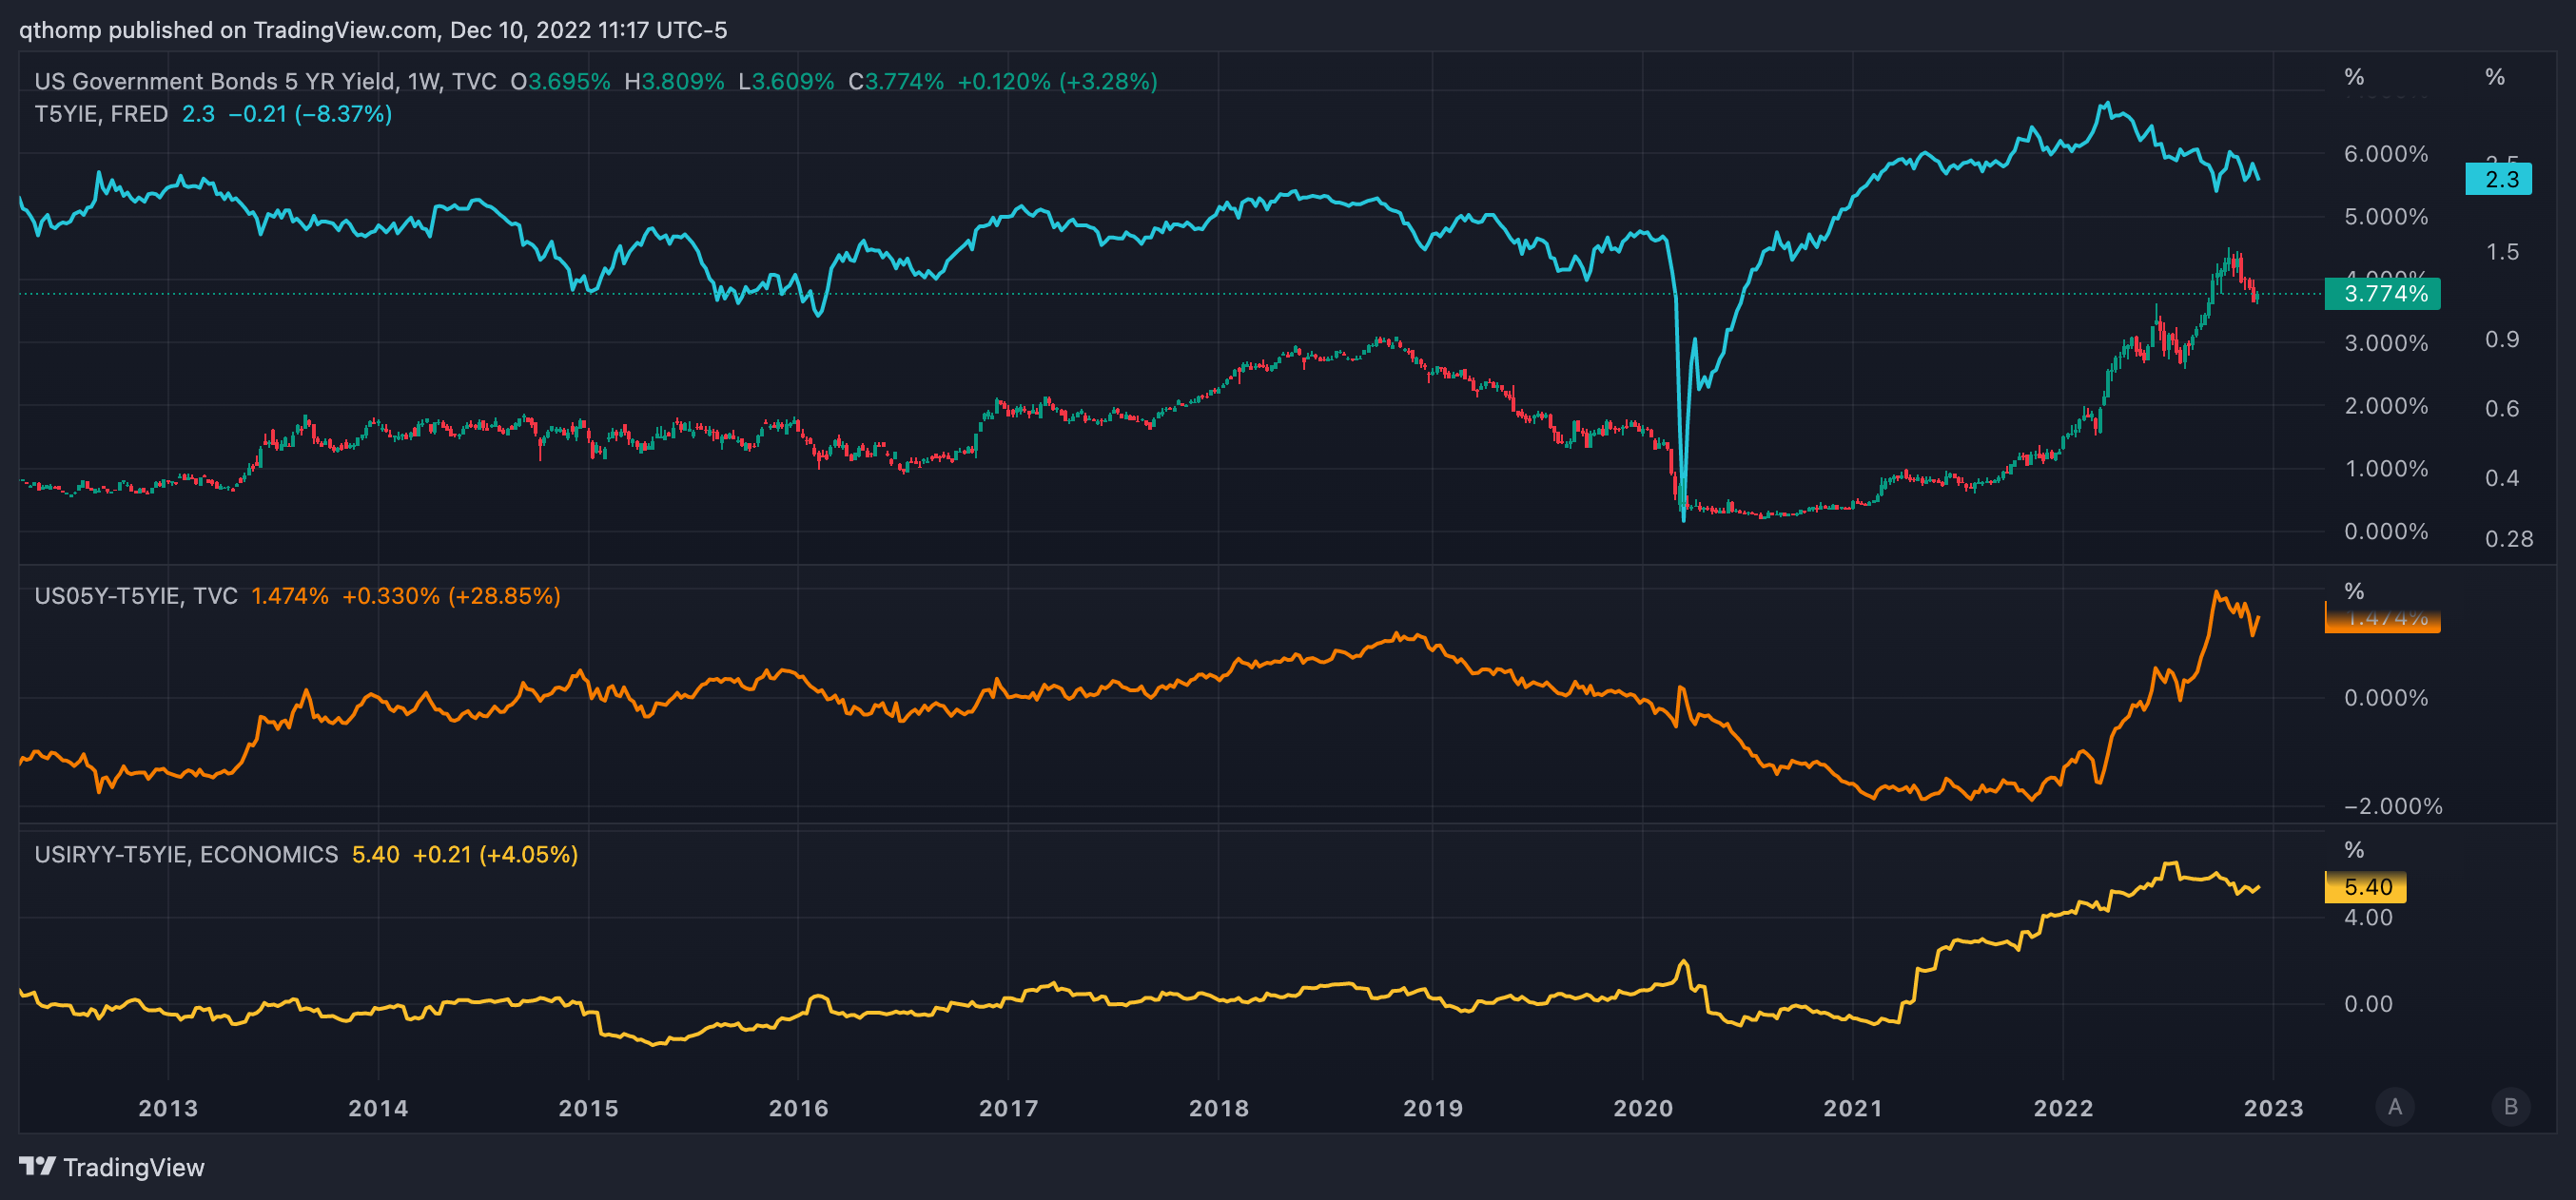
For starters, it’s the bottom yellow line that the Fed is so worried about - the fact that inflation has broken out so high and risks resetting long-term inflation expectations at a much higher level. As 5Y nominal rates have come off ~75 bps since mid-October (top, candles), this has helped to bring in real rates (middle, orange) as inflation expectations (top, blue) have not moved as significantly lower. Keep in mind this is amidst the front end of the curve rising 75 bps with the Fed’s November hike.
Essentially what is going on is the bond market is starting to provide the all clear that inflation is headed meaningfully lower, which is why we’re seeing such an inverted yield curve. As front end rates go higher or even just as additional time passes and they remain at these high levels, the more certain demand destruction becomes and the long bond market is given the green light to go lower. Because of this, the continued inversion and any further downward moves in the yield curve are quite negative for risk assets. In 2018, the 2s-10s yield curve never quite went inverted because the Fed paused and pivoted beforehand - and as highlighted above, things are quite different this time. Watch for stabilization in the yield curve that could signal a sniffing out of a pause. August and October produced two head fakes on this front, but maybe the third time is the charm.
About those head fakes, this is the exact reason we’ve seen these bouts of inverse correlation between stocks (Nasdaq 100, candles) and the yield curve (purple) this year. In April, August and today, stocks have rallied while the yield curve headed lower, saying ‘no pivot’. Equities then caught on to this and went lower, thus causing the yield curve to rally on the hopes of - ‘this will be the time’ the market and lack of liquidity spooks the Fed into pivoting. Then stocks catch onto this and rally back, and the cycle repeats itself.
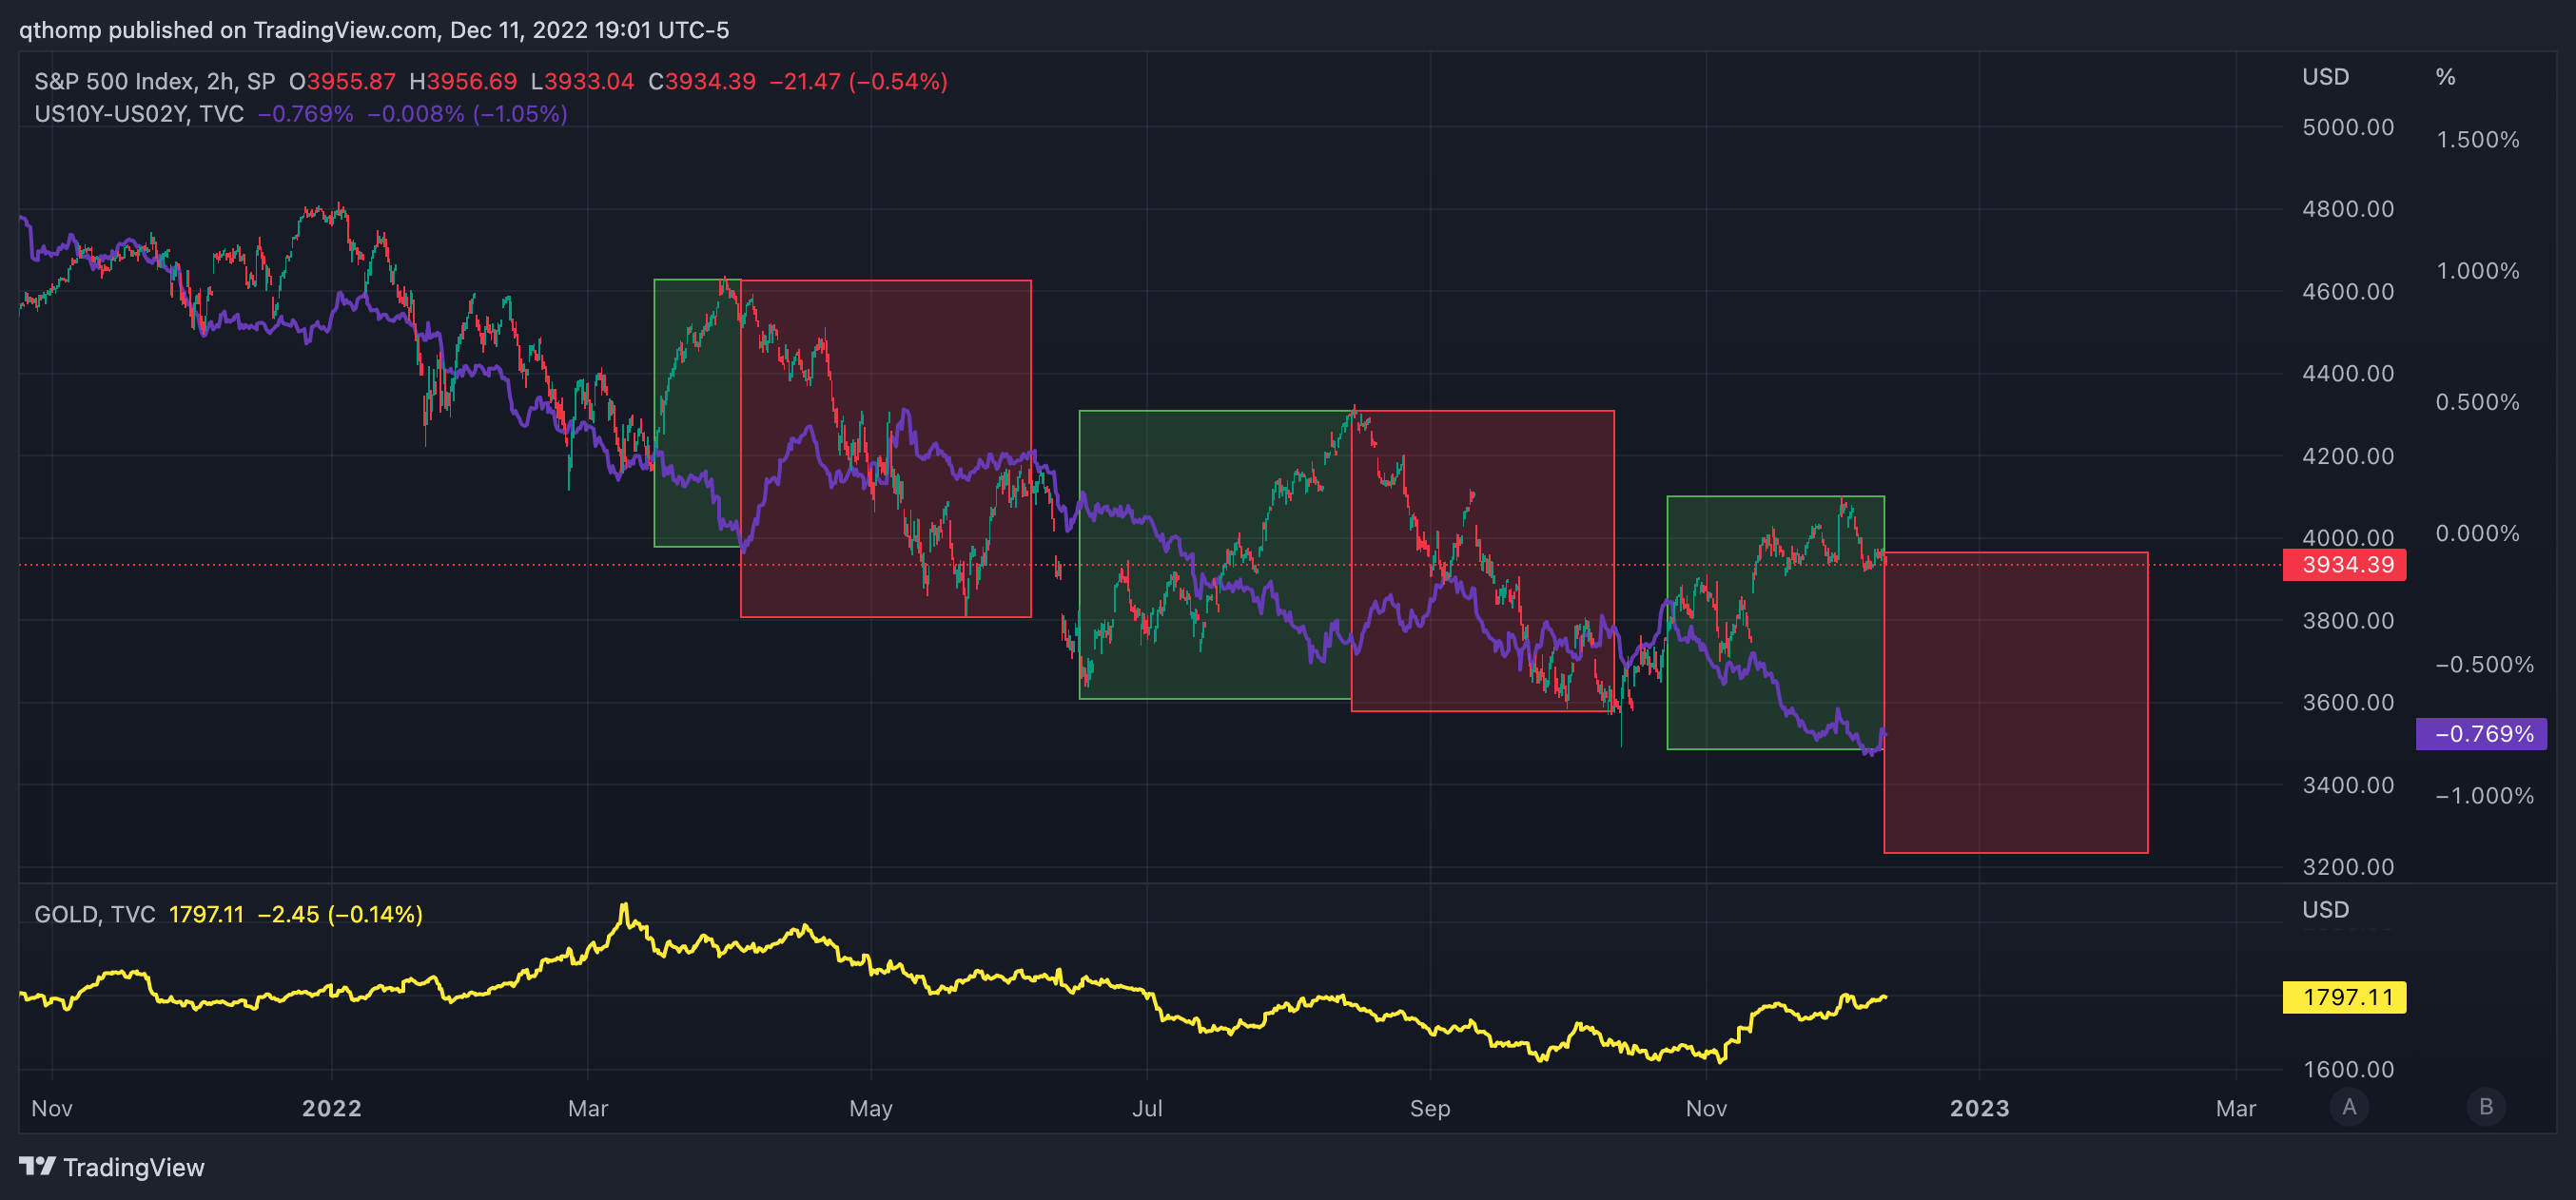
You will know when ‘this will be the time’ is because you will feel sick to your stomach. TBD how close to the horizon that event is, but my gut says it’s near.
So how do I think this plays out? The Fed’s first three scheduled meetings for 2023 are Feb 1, March 22 and May 3. I assign the following probabilities:
50%: Market wakes up to the fact that the Fed is going to crush demand and the economy in its way to lower inflation. This results in very poor performance for risk assets in January leading up to the Feb 1 Fed meeting. However I believe due to forward guidance and the maintenance of its credibility, the Fed will go through with a 25 bps rate hike. Markets worsen from there until they begin to message a pause by end of Feb / early March. The markets meet the pause with reprieve, however the rally is short lived knowing that the liquidity picture is still dire and economic activity begins to worsen more rapidly. Markets continue the sell off, leading to the shortest time ever between a Fed pause and pivot (end of Q2 / beginning Q3), and a serious blow to their credibility.
25%: Market wakes up to the fact that the Fed is going to crush demand and the economy in its way to lower inflation. This results in horrible performance for risk assets in January leading up to the Feb 1 Fed meeting, including a market breaking liquidity event. This forces the Fed to not hike and pause until further notice. The markets meet the pause with reprieve, however the rally is short lived knowing that the liquidity picture is still dire and economic activity begins to worsen more rapidly. Markets continue the sell off, leading to the shortest time ever between a Fed pause and pivot (middle/end of Q2), and a serious blow to their credibility.
25%: Market continues to shake off weak economic data with the upcoming Fed pause and eventual pivots in sight. Labor market remains strong, inflation slows quicker than expected and assets remain range bound. Fed hikes another 25 or 50 bps on Feb 1 and indicates another potential 25 bps hike at its March 22 meeting. By late Feb / early March, economic data worsens. Fed either pauses completely or hikes 25 bps with a pause. Market rallies briefly into April but is not ultimately satisfied as it wants a full pivot given how weak the economy is and earnings are also starting to reflect that. Markets sell off in late Q2, reaching a liquidity event in Q3 forcing the Fed to pivot.
So where to go to wait out the storm?Long gold
Gold is typically the first to sniff out a pivot. The bullion also has a number of structural supply and demand tailwinds at its back - summarized best this article.
The below chart shows gold price (yellow) vs. US real rates - 5Y (dark blue) and 10Y (light blue).
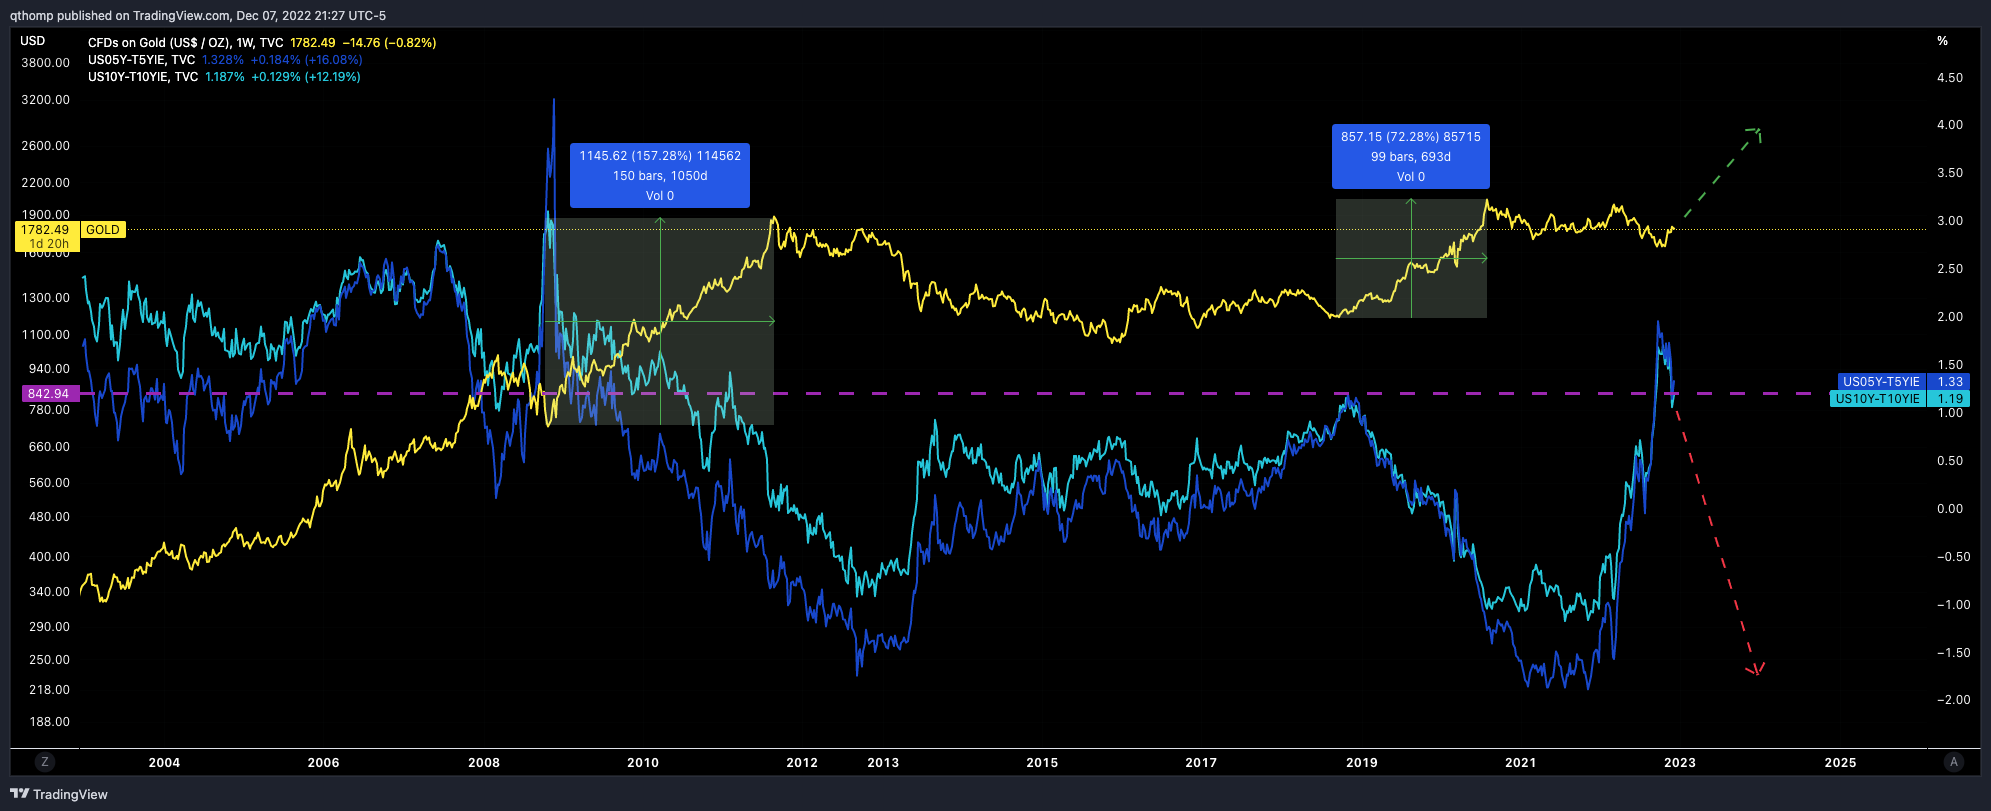
Once real rates peak (long bond falling faster than inflation), as I believe they have, gold begins its run. Risk assets, however, do not bottom until the Fed decisively pivots because the downward trend in the economy takes time to play out.
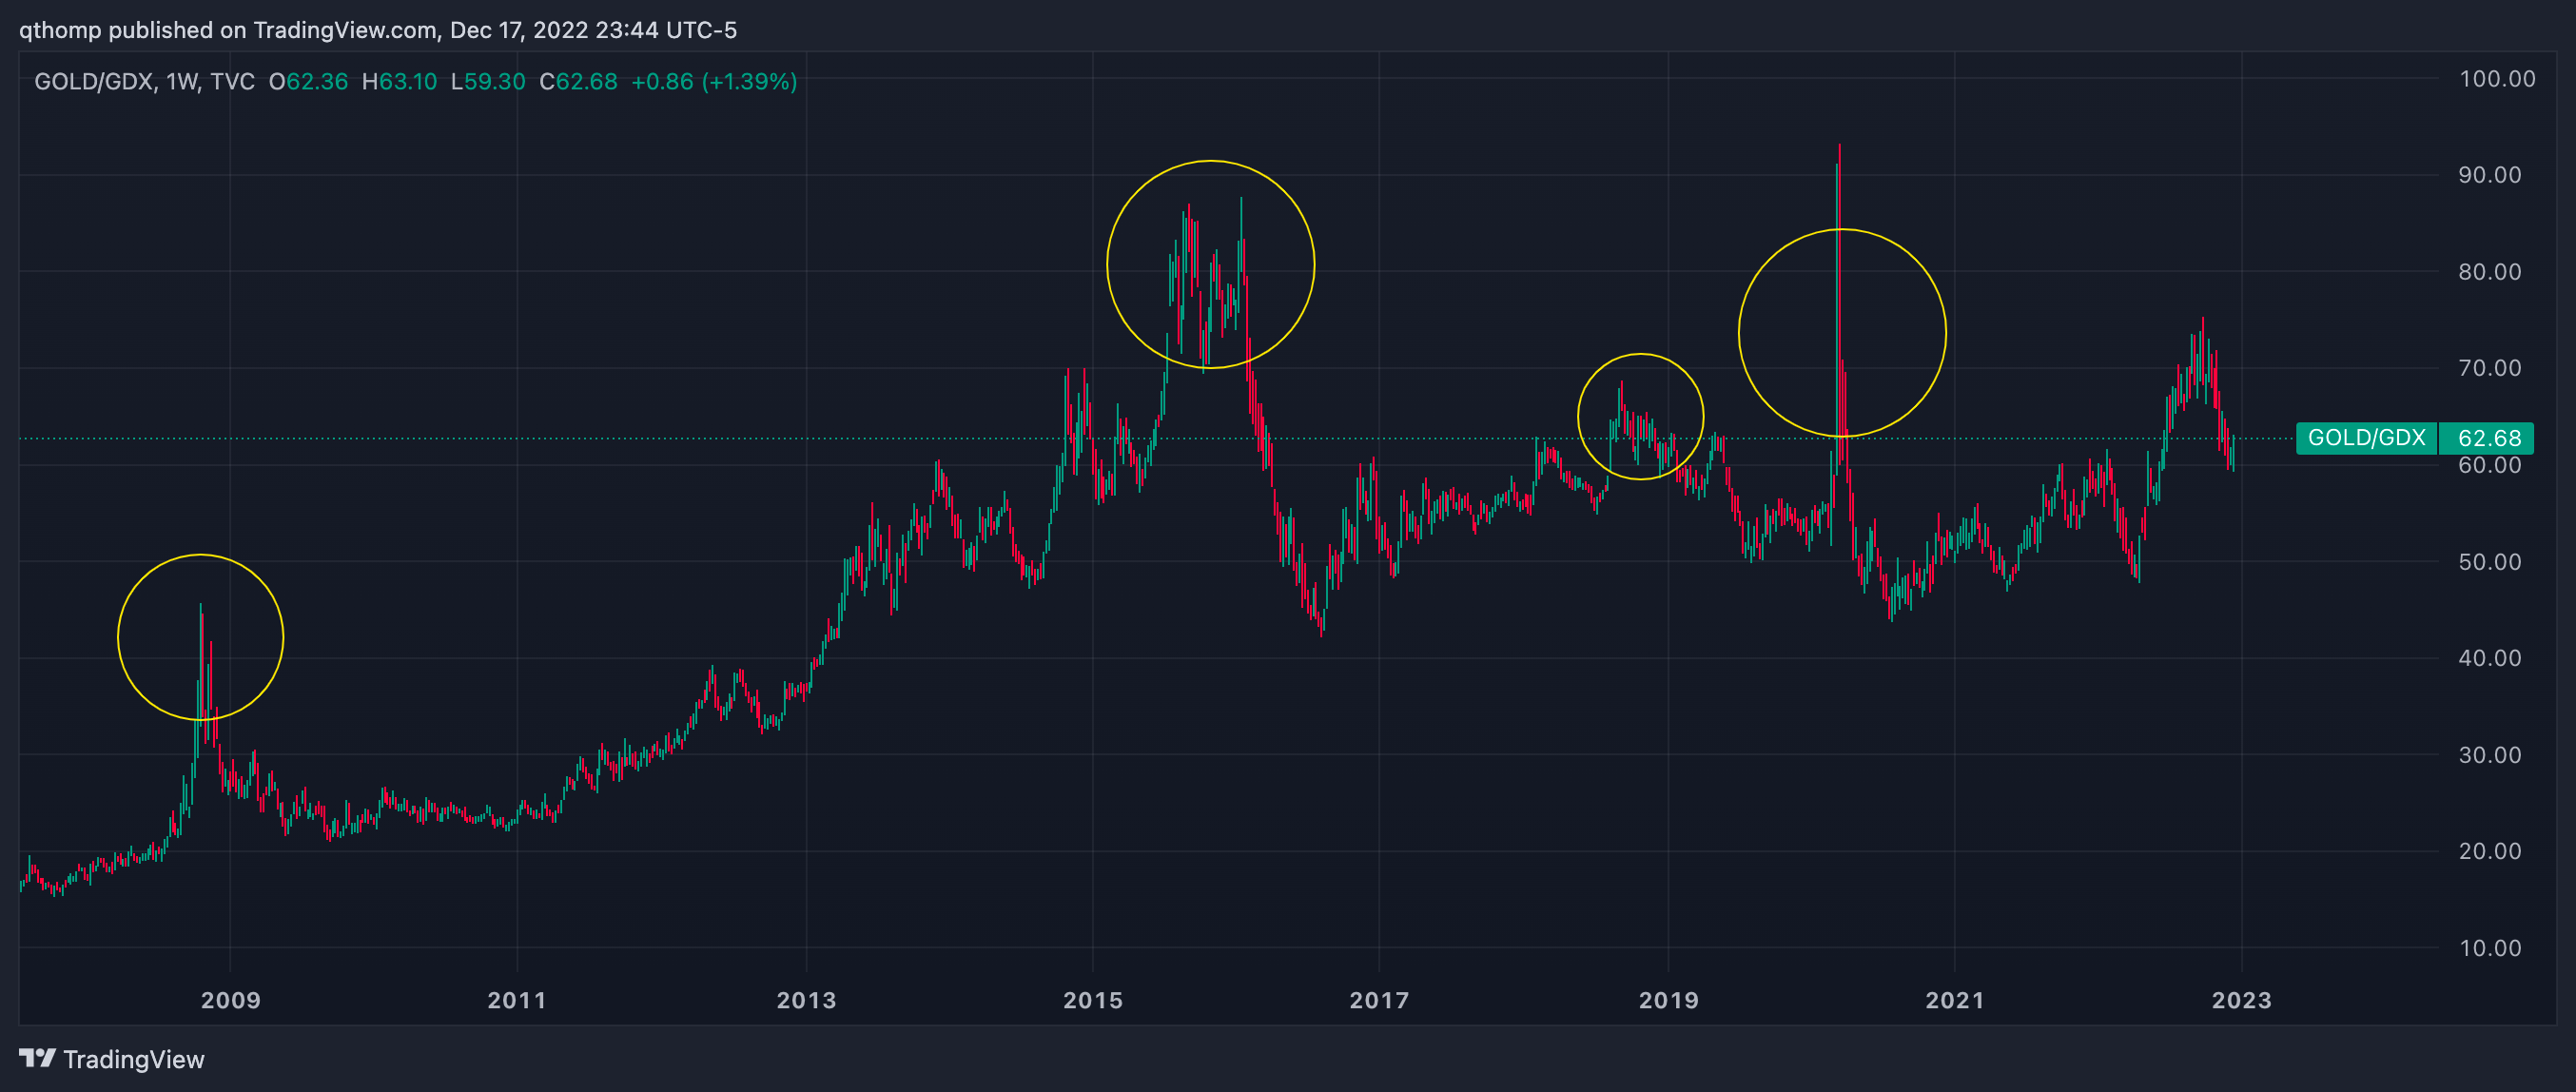
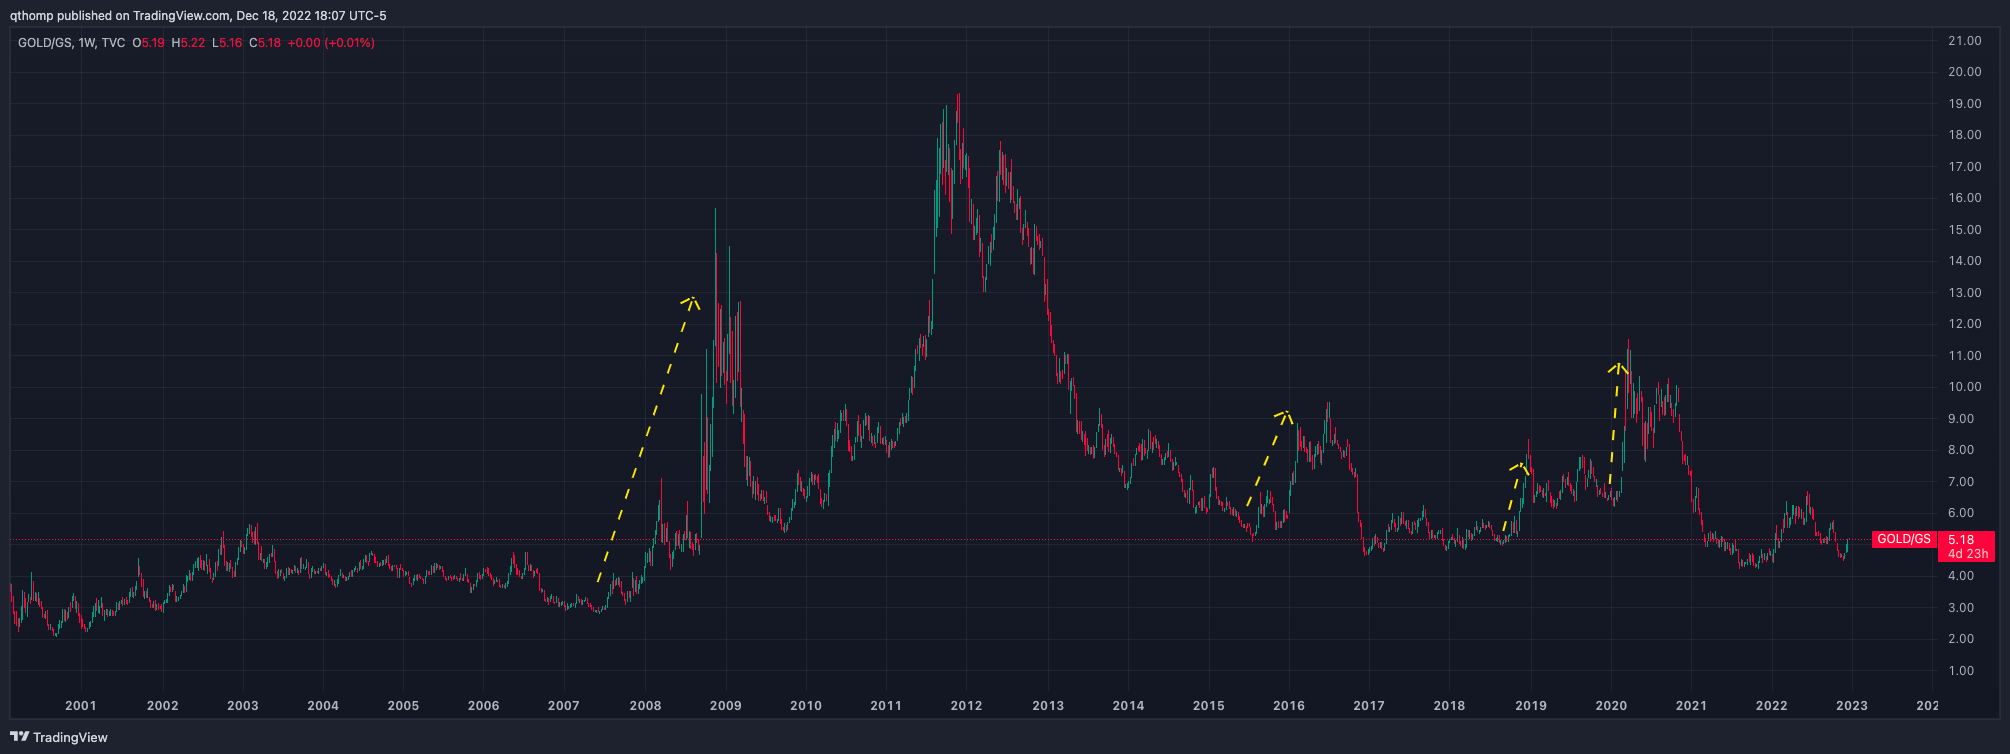
If one is structurally bullish gold, there is the argument to be made for gold miner equities as they are just leveraged exposure. I do believe the backdrop there is quite favorable, however I also believe there is liquidity event risk. As seen in previous market liquidity events highlighted below, the ratio of gold to gold miners temporarily spikes. I think a liquidity event is on the horizon over the next 3-9 months and think it is prudent to skew exposure towards gold itself and then rotate that into miners on one of these events.
So what is the risk to the gold thesis? It largely boils down to real rates not falling or a liquidity event. The former would mean the difference between interest rates and inflation increases. Given inflation has peaked (as seen by prices of everything and expected worsening due to the weak economic direction), long-term inflation expectations would need to fall faster than nominal interest rates for real rates to rise (keep in mind we’re on a 5 or 10 year tenor). This is also highly unlikely because it implies the Fed will navigate a soft landing which they are all but explicitly saying is not possible.
Why does it indicate a soft landing? Because it would mean nominal interest rates would have to basically stay where they’re at while inflation falls. With 10 year rates at 3.5% (highest since 2011), this would imply above trend economic growth going forward, thus a soft landing.
And why is the Fed not able to conduct a soft landing? Well for starters it’s never really been done in the modern QE/QT era. And secondly, as mentioned previously, above trend growth would be required to maintain higher long-term nominal rates. Well in the latest Fed SEP released last week, they project a 0.5%, 0.5% and 1.6% real GDP growth rate in 2022, 2023 and 2024 respectively. Additionally they are projecting an increase in unemployment rate in 2023 and 2024 as well, which would coincide with weaker growth.
In the near term, I believe real rates have to go lower. In the more medium to long-term given the structural supply issues mentioned earlier, there is a risk that after the near-term deflationary economic bust, inflation rears it’s head again. When the Fed reignites QE and federal stimulus spending picks back up, I expect the secular commodity bull run to resume. This could risk an unhinging of longer run inflation expectations, bringing long end nominal rates up with them. However at that point after all the economic havoc wreaked by the Fed’s QT, I would imagine the consensus would be against excessive rate hikes and balance sheet reduction. In this case I think inflation would be allowed to run hot, coinciding with discussions around increasing the 2% target. If this were to occur, real rates would actually remain low or negative. With that said, I think that’s a next cycle concern as the economy is too troubled in the near-term for this to occur.
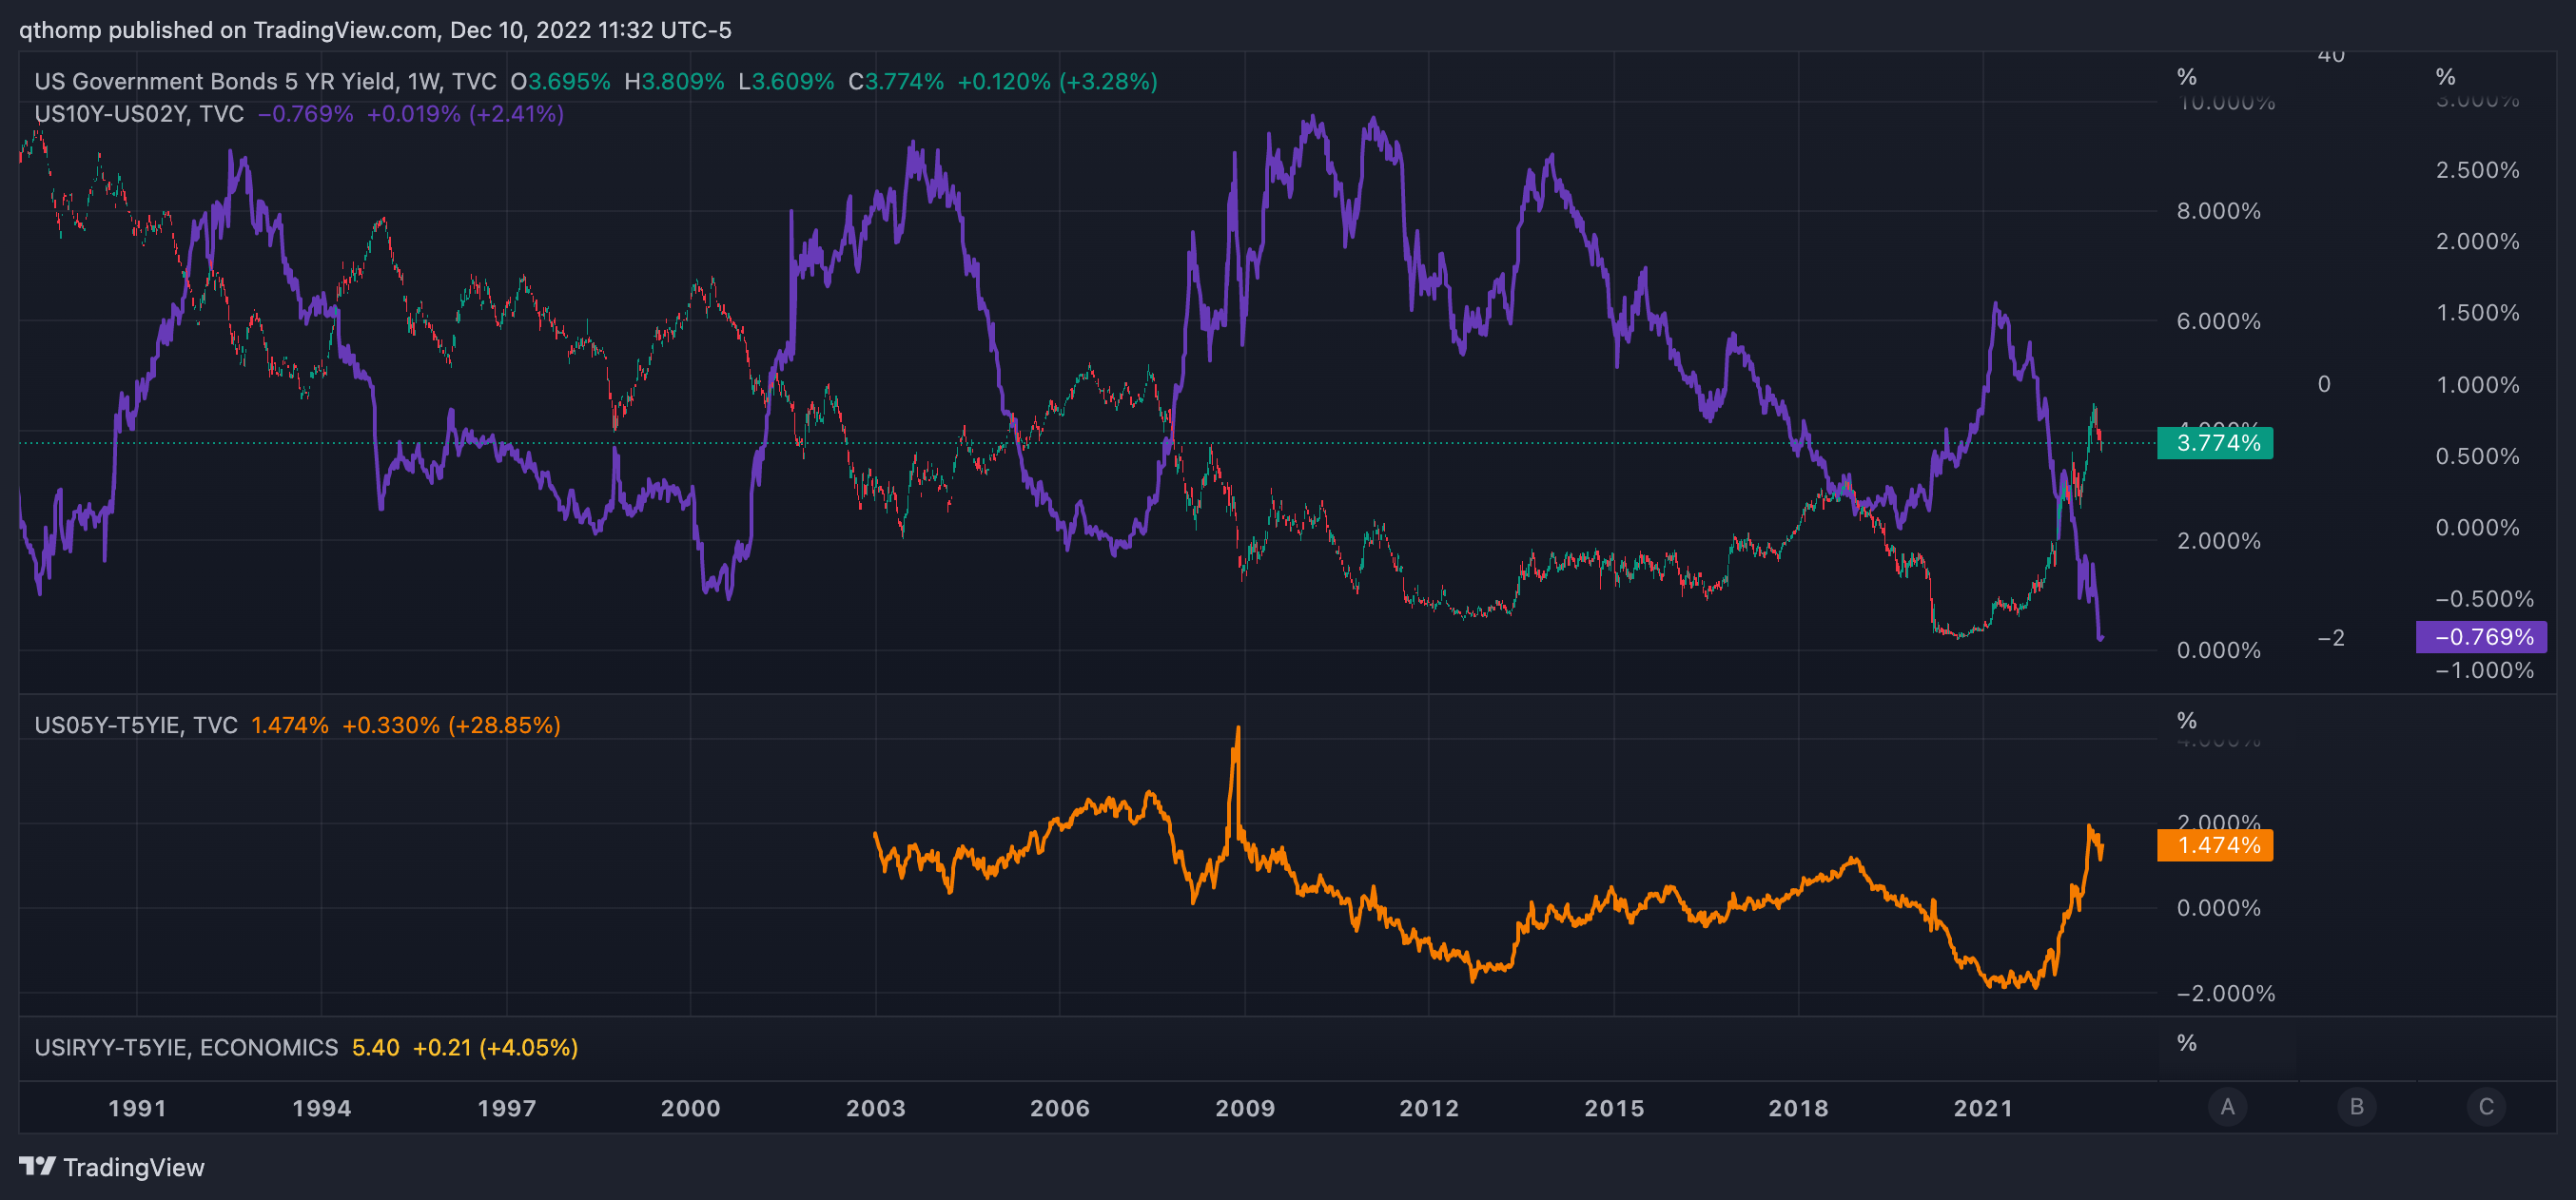
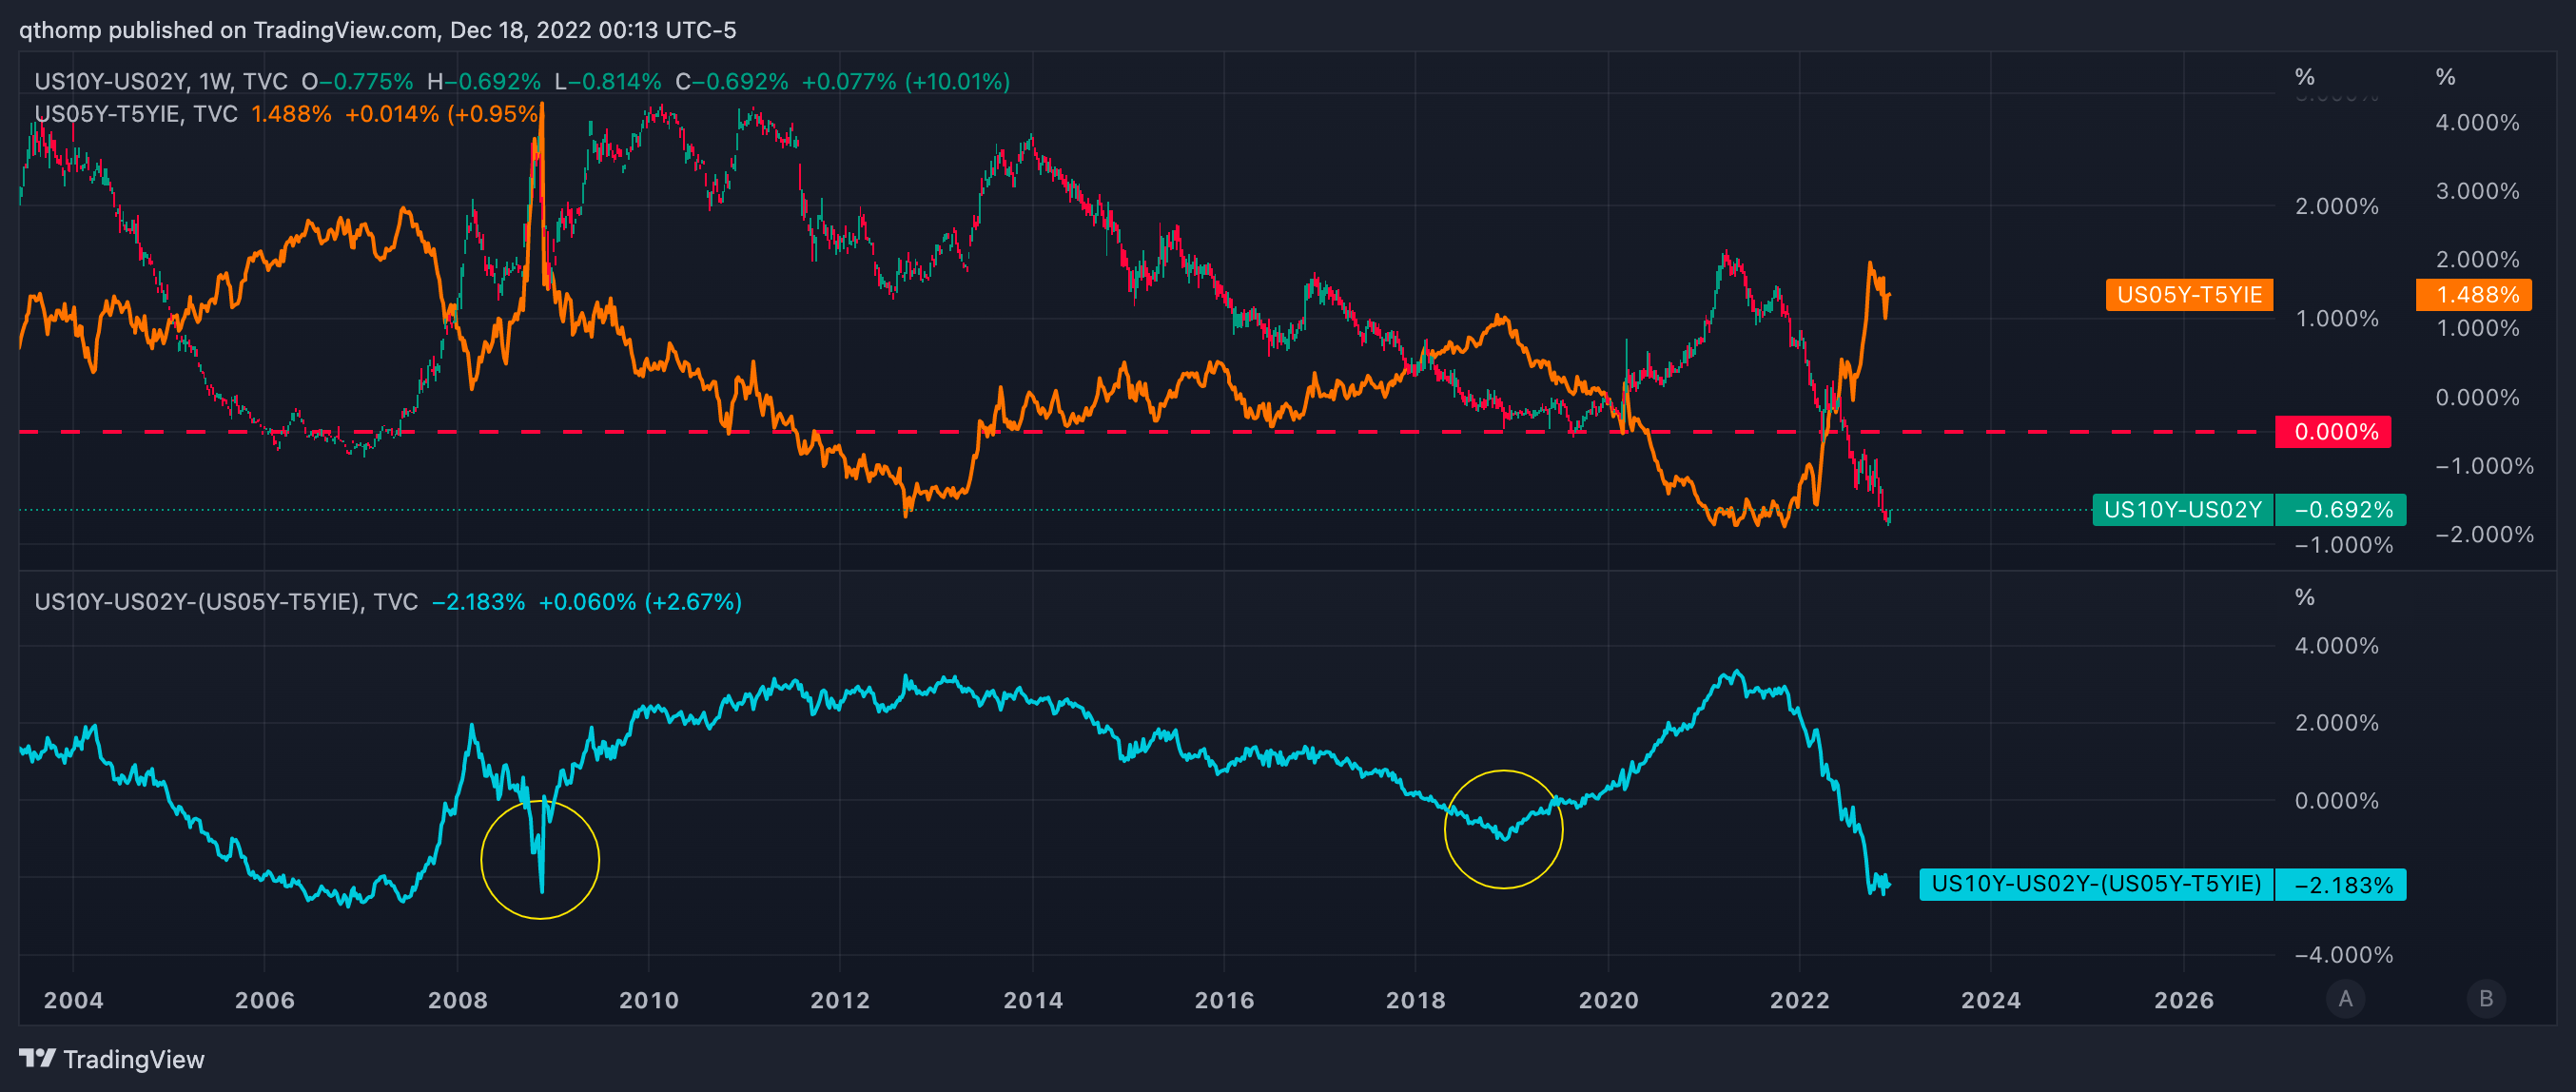
So to summarize, the exact crux of the situation is - as front end rates go higher (or even just as additional time passes and they remain at these high levels), the more certain demand destruction becomes and the long bond market is given the green light to go lower. This leads to a positive correlation in the near-term between the yield curve and real rates (yield curve down, real rates down), but in order for risk assets to put a bottom in the yield curve needs to rise (uninvert) with real rates continuing their decline (leading to a negative correlation). The chart below shows the (10Y-2Y yield curve) - real 5Y interest rates.
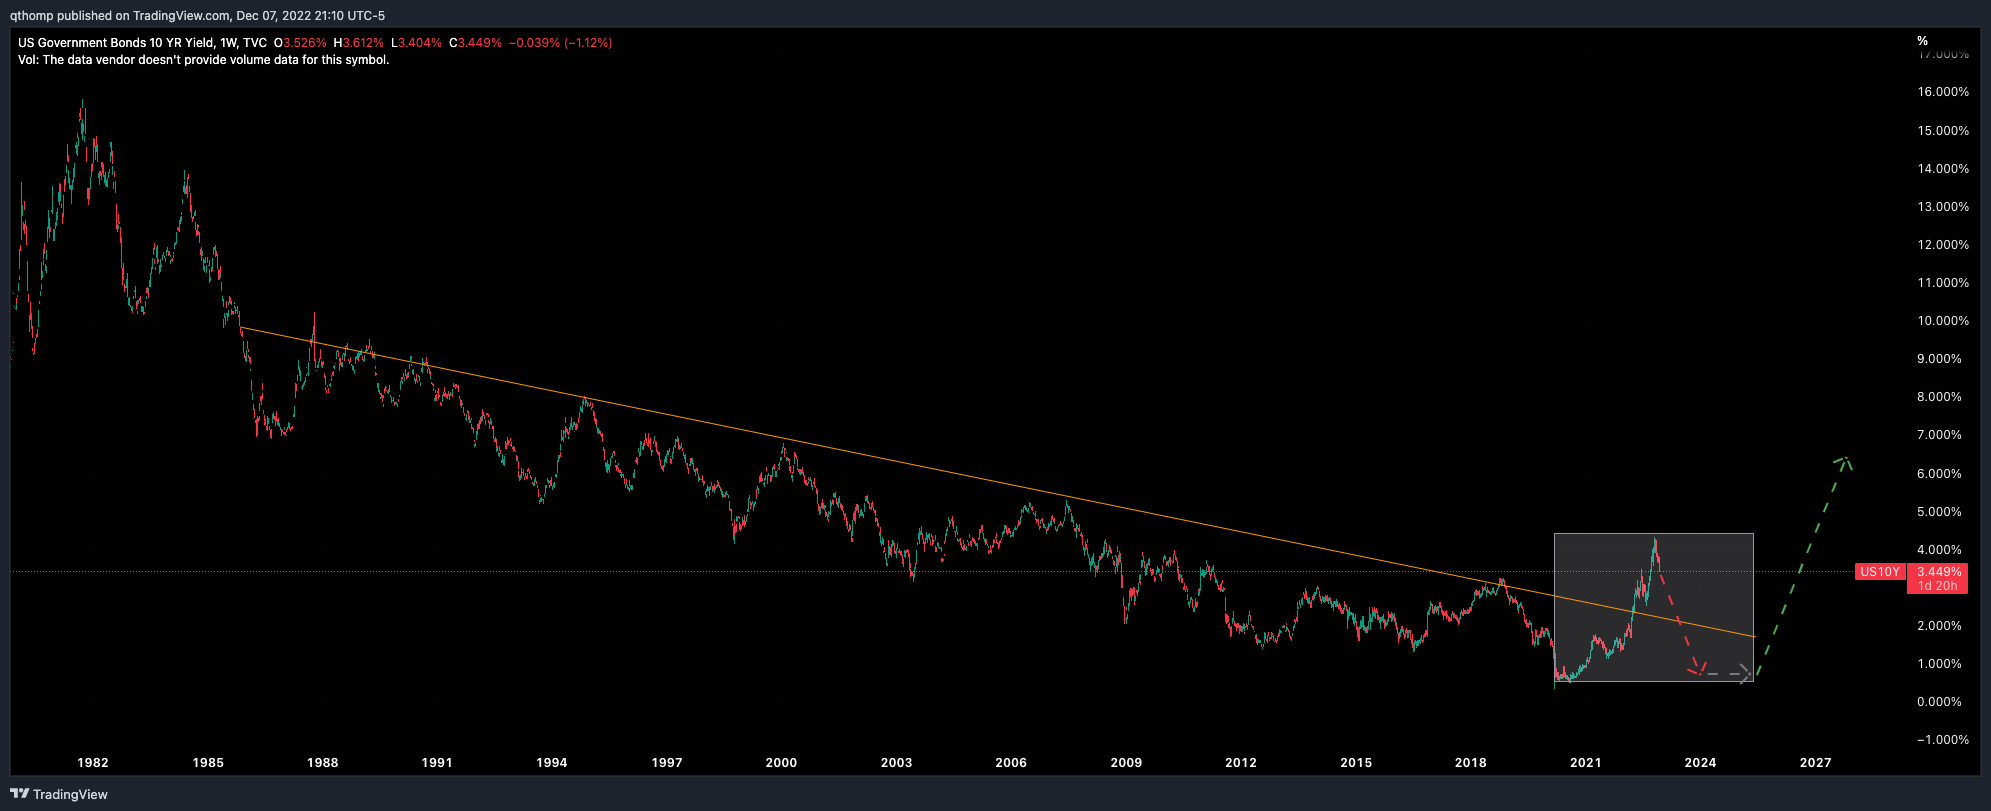
Long treasuries
So why gold and not long-dated treasuries as the core asset you might ask? Particularly if we’re headed towards a large deflationary bust like I expect? Potential path for 10Y yields laid out below. Under this assumption, obviously treasuries would perform well also.
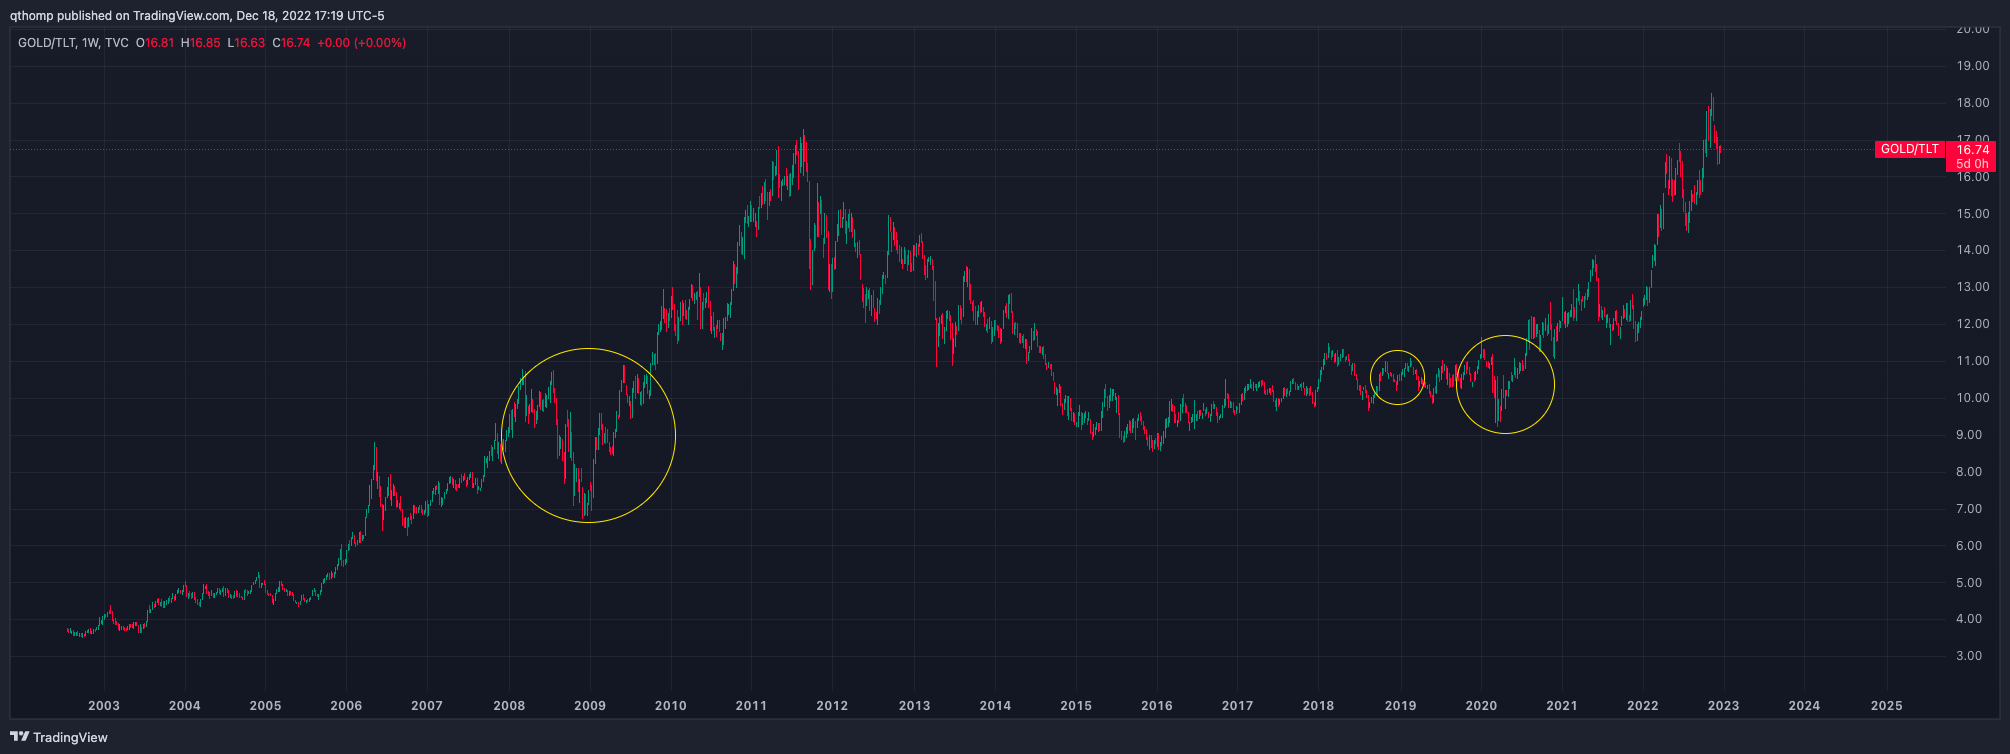
I’m still refining my view here but currently lean towards gold given the secular trend I believe will play out in Gold versus US dollars (which if at low enough interest rates, that’s essentially what treasuries are). Looking at the chart below comparing Gold / US treasury performance, it looks like a massive cup and handle chart that I want to be long. It is important to highlight though that in short-term liquidity events like 08-09, Q4 2018 and Q1 2020, treasuries often outperform. The level of that outperformance has seemed to decline since the GFC though - in my opinion likely due to the gradual expectation of bigger and bigger QE. But it’s still important to remember that treasuries remain as the world’s collateral until proven otherwise. For this reason I have begun building an allocation to long-dated treasuries that can be rotated to gold if a liquidity event occurs.
Short large cap tech and big banks
Just gold and treasuries? How boring. Thus I will add the equity side of the trade I also like. In fact I think they make a fantastic pair trade. I think we’re due for another ‘yellow line’ in the chart below.
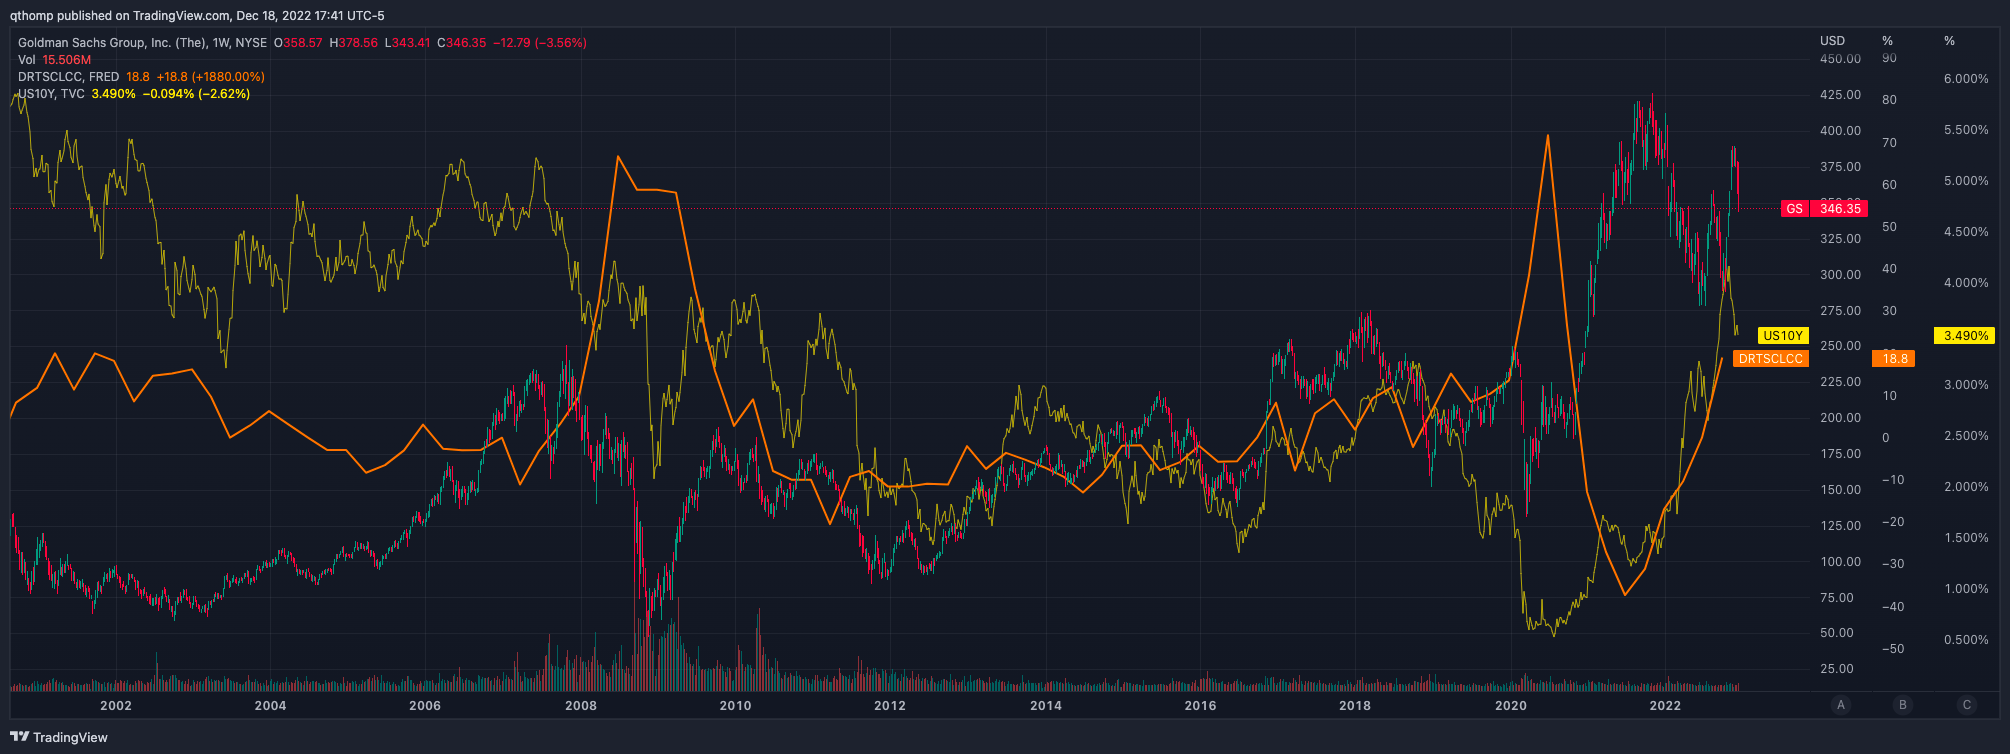
If my thesis plays out around the economy and potential market stress caused by the Fed’s QT and balance sheet reduction, I think large cap tech and big banks stand to suffer the most. For big banks like Goldman (candles), the chart below shows it’s typically not a good time to be a shareholder when rates (yellow) are falling and lending standards are significantly tightening (orange). With a weakening economy, already weakened consumers (lowest savings rate of all time and consumer debt levels back to highs) and muted capital markets activity, it’s difficult to see where banks earnings growth will come from over the next year.
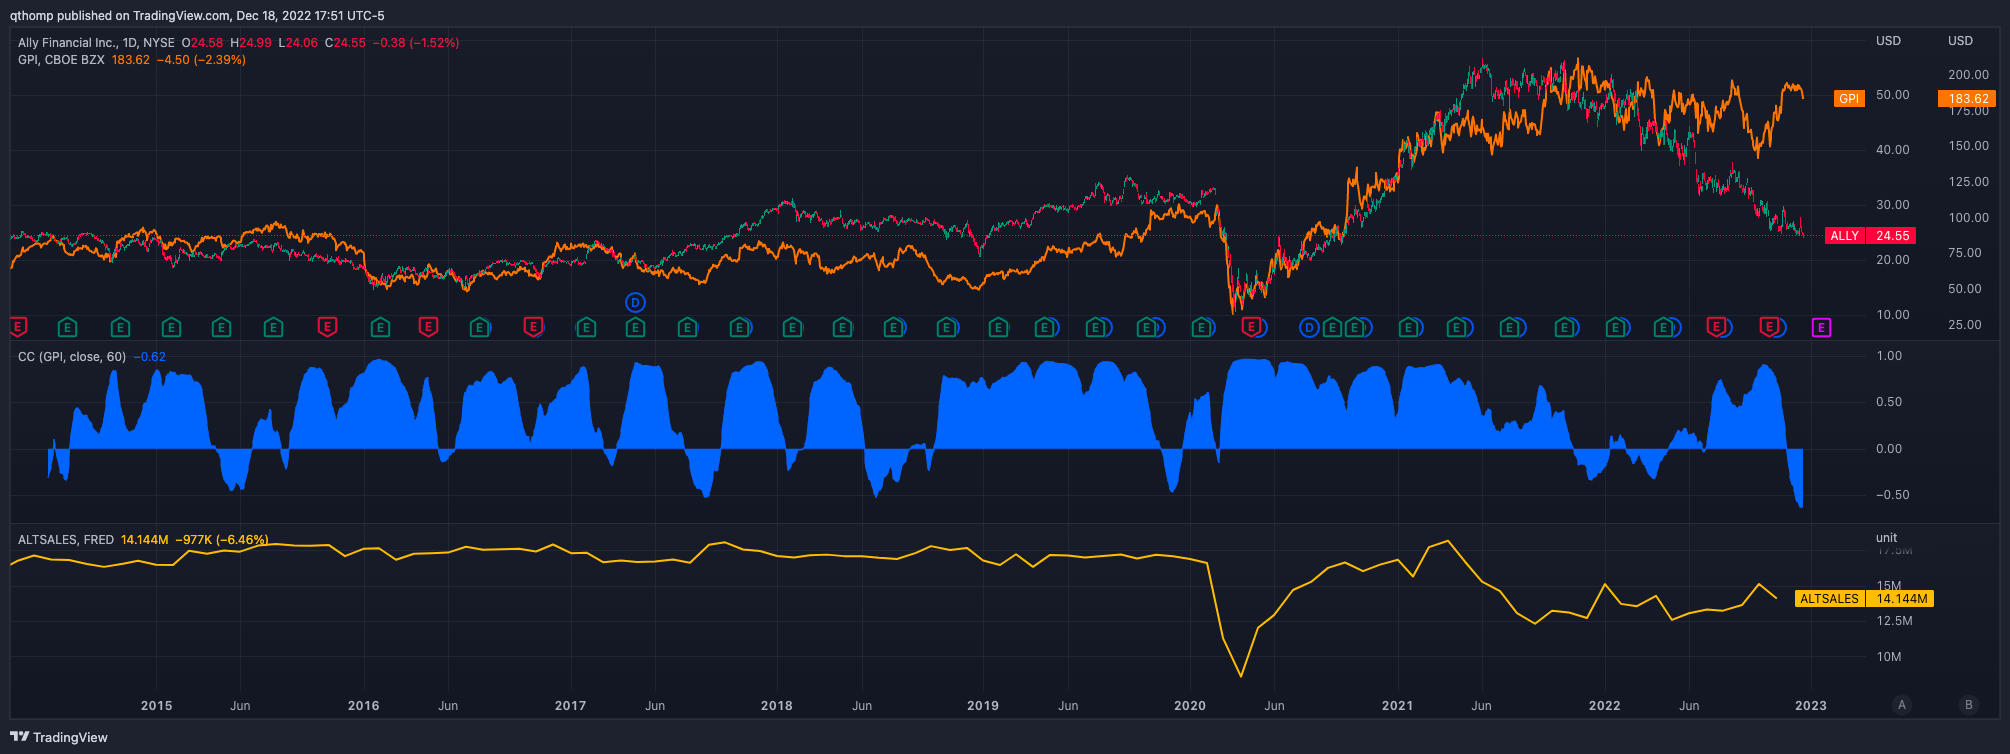
Another place to look that’s interesting is Ally Financial and other banks that are large auto financiers (Wells Fargo is another). Ally is the largest auto lender in the world and are trading back to early March 2020 levels. The chart below shows the share price (candles) vs. Group 1 Automotive (orange), a large international car dealer. The yellow line below shows light weight vehicle sales which peaked in early 2021 on the back of COVID stimulus packages. If historical correlations mean anything, I wouldn’t want to own Group 1.
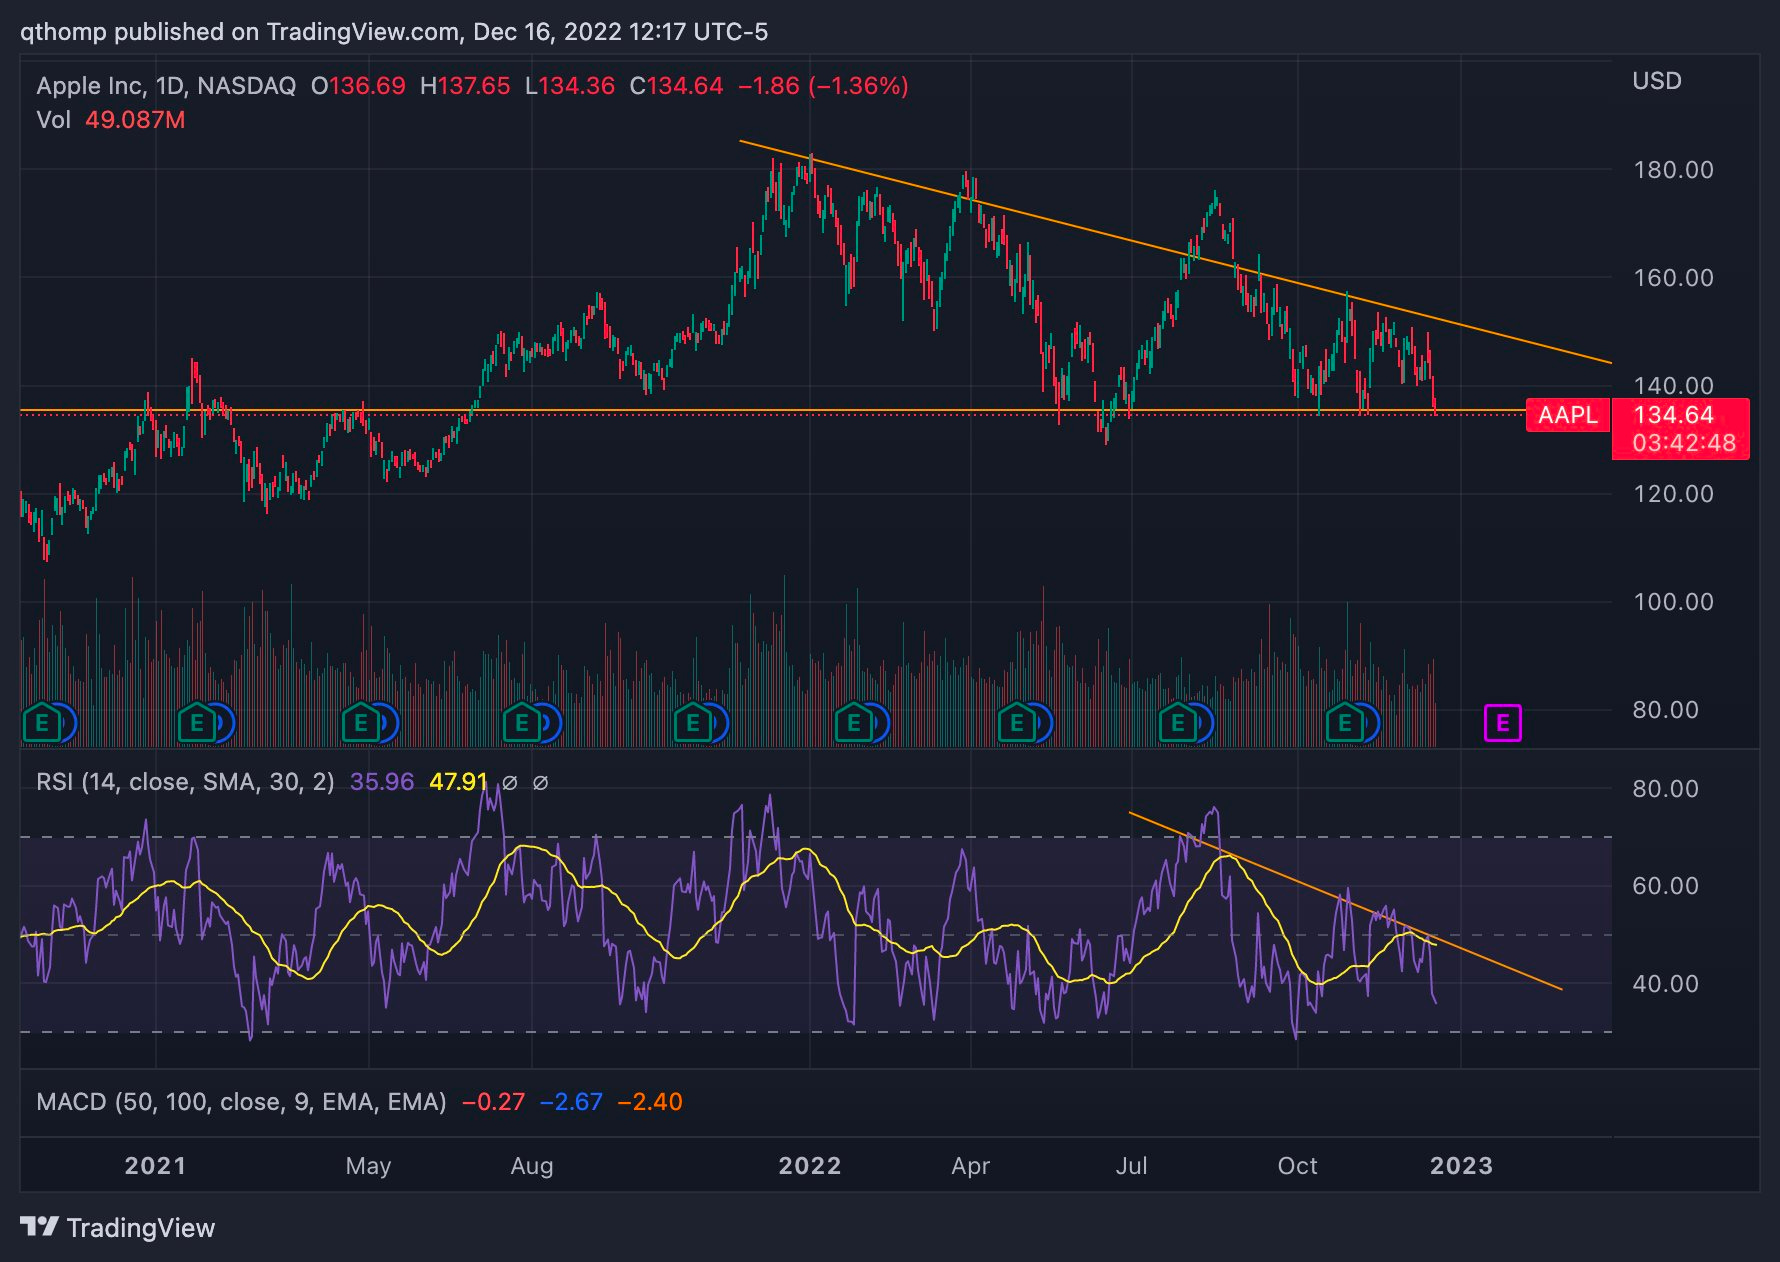
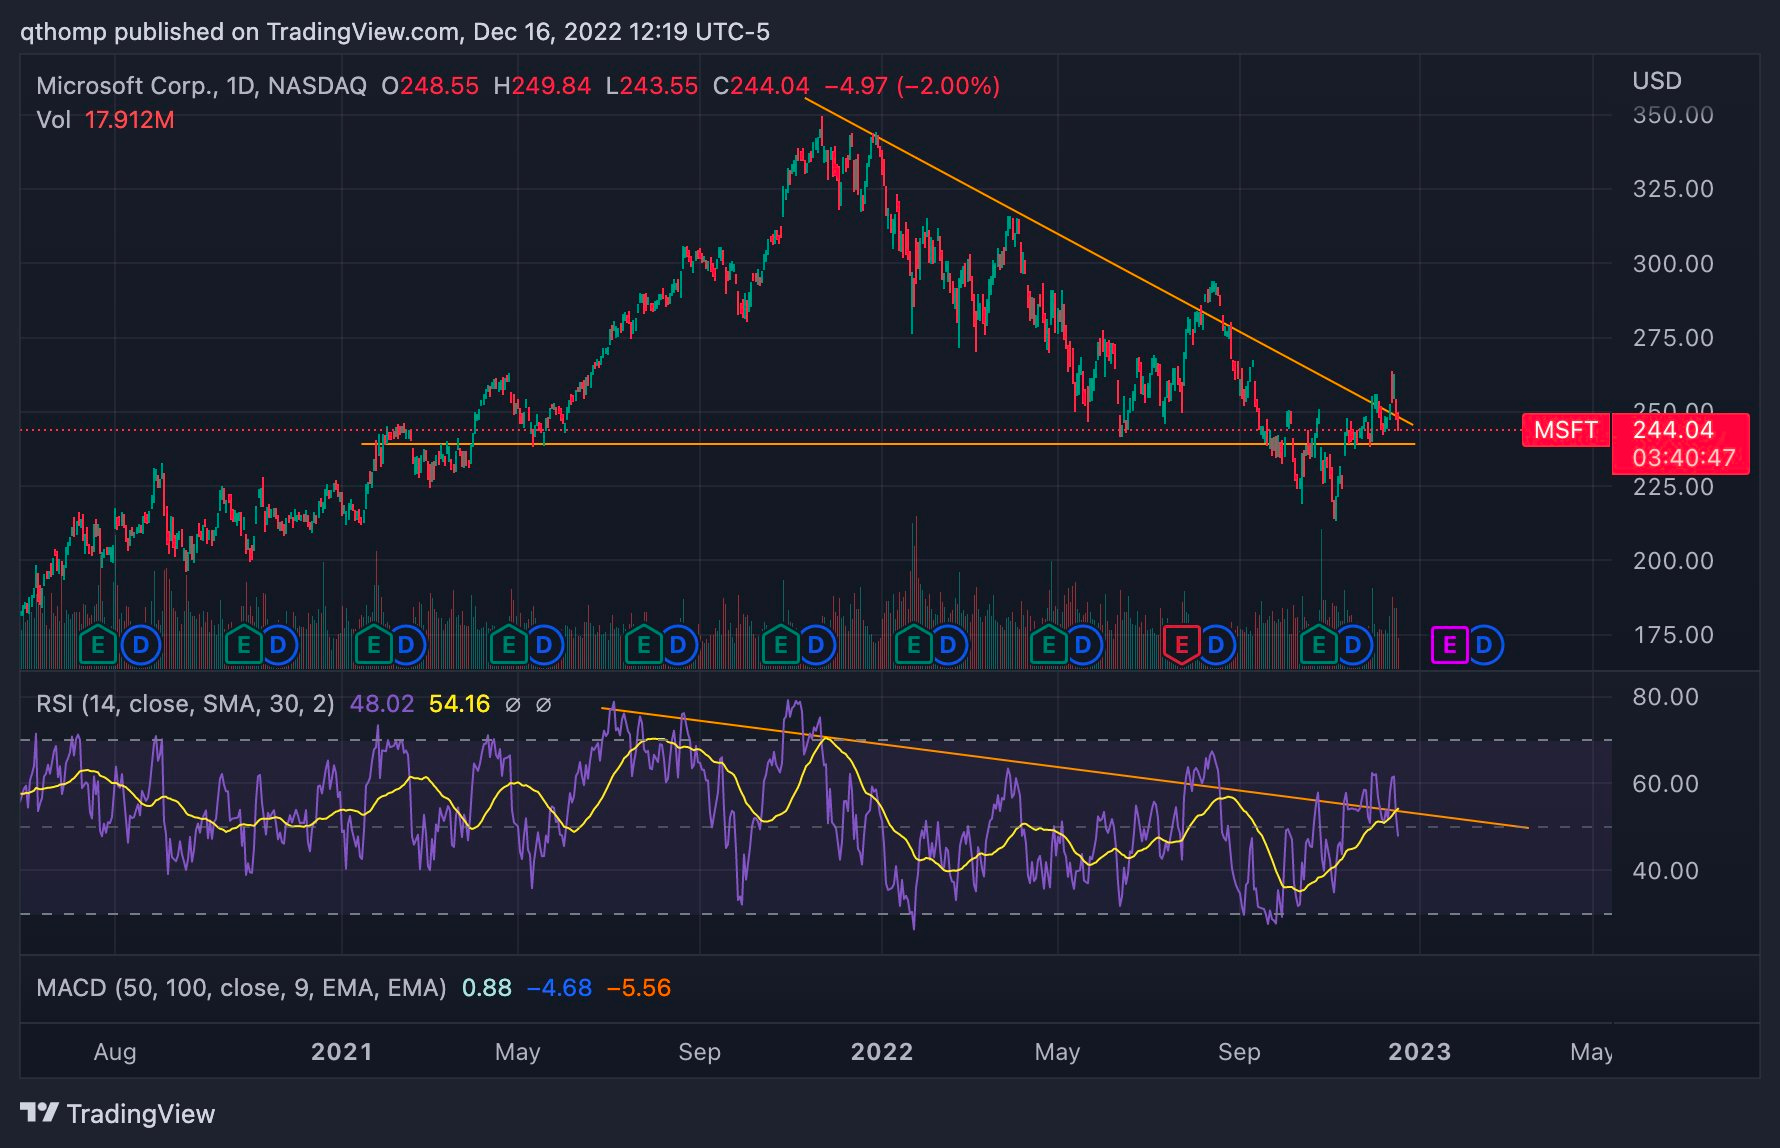
As for big tech, they’re one of the few remaining pins to fall. More speculative technology like ARKK and its holdings have already seen a tremendous wash out and eventually the Fed’s QT and liquidity retraction catches up to the best of them. As shown below, Apple and Microsoft RSIs are rolling over just as they are testing their range bottoms. I think there’s more trouble ahead
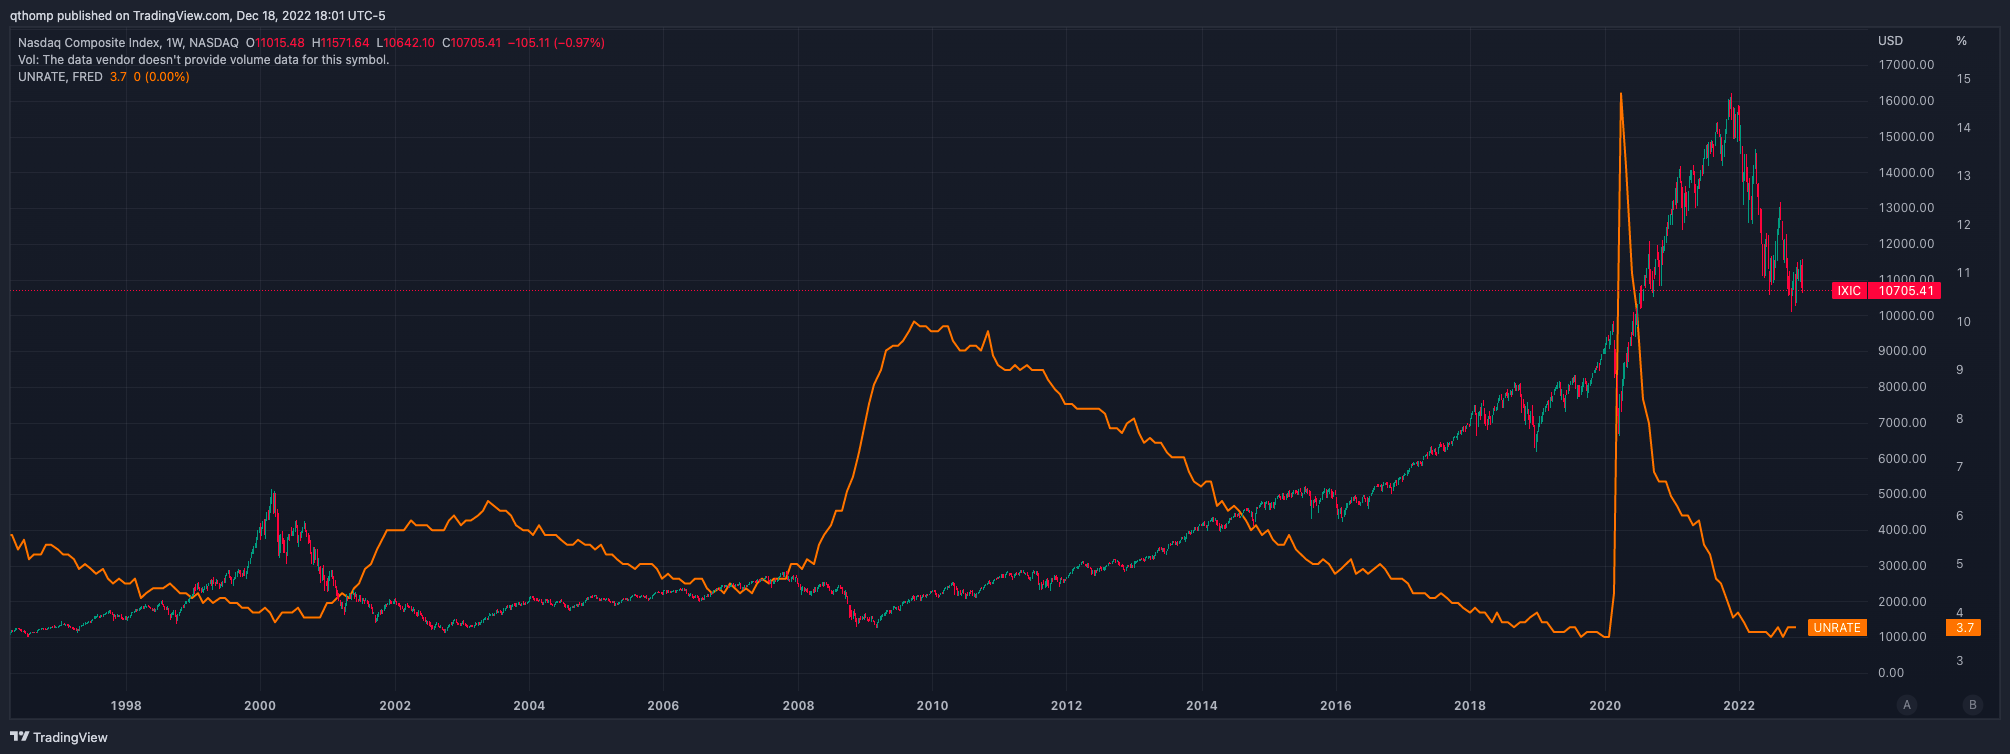
As the Fed continues to remind us month after month, they are targeting demand destruction, lower GDP and increased unemployment. In simplest terms shown below, a rising unemployment rate (orange) and the NASDAQ (candles) are typically inversely correlated.
What to do with oil?
Saving the best for last? Maybe. I personally find the oil and commodity situation as one of the most interesting in the whole macro landscape. It’s the most global, involves the most different individual actors (and actresses) and has become one of the most important assets to follow - and rightfully so.
I think it deserves it’s own full write up, but in short - on a long time horizon, I think oil performs really well. There has been chronic underinvestment into its production globally for over 5 years, with a big driver behind that being almost no access to capital for the sector. This secular shift in supply and demand has caused historical price correlations (ie DXY and WTI) to break, and will likely remain that way until the supply problem is fixed. Until then, whoever controls the oil will hold leverage and economic strength on a global stage (US, Russia, Saudi). You may have heard people on Twitter say something like “oil is the new vigilante, taking the baton from the bond vigilantes”.
In the near-term, however I am staying away from oil and producers. I simply think the demand destruction and downward economic inertia are too strong to meaningfully reverse price until the Fed stops QT. No matter how tight supply is, oil can go lower - it’s a physical spot market that needs to clear at a price. Obviously this is different than the term structure going out the curve which largely affects oil company equity prices more, but they’re correlated. This is one to revisit in the new year.
And that’s all for today. Sorry for the doom and gloom. Hope everyone has a fantastic holiday season and gets some down time. Let’s see what year end and Q1 2023 bring us.