

Scouting the Tape - June 14, 2026
(Unique) macro idea generation and (insightful) market thoughts.
A few weeks ago I wrote:
The following week I wrote:
I think we are approaching that time. Today’s report carries a lot more actionable near-term trade ideas. Patience in execution is something I am ALWAYS working on.
Recapping recent thoughts.
I’m pretty happy with how we’re seeing markets of late. I hope this place has provided you some value and signal.
I would largely attribute this idea to understanding the STRC and MSTR dynamics that provided glaring red flags in advance of this decline.
 Quinn Thompson@qthompTBD whether or not $STRC holders will get a dividend rate increase announced in a few days.
 Michael Saylor @saylorAll-time high volume. $1.53B of liquidity. Two cents of volatility. Closed at par. $STRC12:25 AM · May 29, 2026 · 20.6K Views28 Likes
On May 30th we stressed caution around tech stocks and the Nasdaq sold off nearly -10%.
We’ve been bearish oil for nearly a month now due to the rising importance of getting barrels flowing by end of June alongside declining approval ratings. It’s important to play out the policymaker reaction functions which we discussed further last week…other thought processes here and here.
Quinn Thompson@qthompThe first potential signs of another major Trump 🌮 His political capital amongst voters is "running on E" and he needs to divert attention away from the failed Iran War as his polling and rating numbers decline. He's already brought the largest aircraft carrier and strike
 Giovanni Staunovo🛢 @staunovo#Iran: Over the past 24 hours, 26 ships, including oil tankers, container ships, and other commercial vessels, passed through the Strait of Hormuz with the coordination and security of the IRGC Navy. Traffic through the Strait of Hormuz is being carried out with permission and in12:54 PM · May 20, 2026 · 45.1K Views8 Replies · 13 Reposts · 178 Likes
I think some of our other recent ideas will start becoming relevant over the coming weeks as well. Let’s make some money off them.


The SOFR long opportunity is imminent.
Over the last few months I have been writing a ton about rates and SOFR.
I can’t help but keep thinking back to this line…“the optimal entries should come when equities are still trading well but inflation is surprising to the upside.”
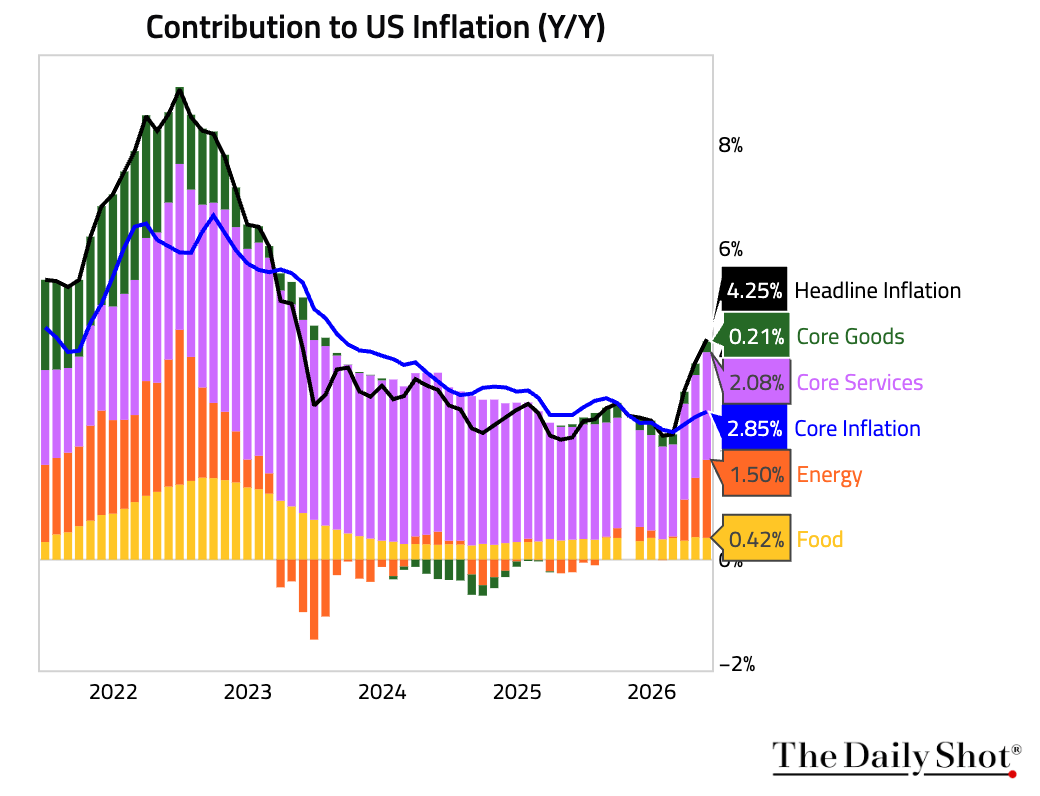
The Fed is not going to hike into this at a time when policymakers at the White House and Fed are stressing the difference between headline and core inflation more than ever.
Meanwhile market expectations are reaching extreme levels.
 Ole S Hansen@Ole_S_HansenThe leveraged fund short position in SOFR futures increased by 12% during the latest reporting week to 9 June to a record 2.62 million contracts, equivalent to a notional value of more than USD 600 billion. The aggressive build-up in short positions over the past month comes
 12:07 PM · Jun 14, 2026 · 4.78K Views3 Replies · 12 Reposts · 39 Likes
I loved Ole’s tweets on this topic because they depict how the market’s current expectations are almost directly opposed to how I view future policymaker actions. Leveraged funds have been getting much longer 2, 5 and 10 year duration Treasuries and much shorter Fed Funds - the exact reason why yield curves have been flattening so dramatically. But I view the ultimate policy response from the Bessent/Warsh camp to be pressure on the front end and a steepening of the curve. The bar for rate hikes is extremely high in my opinion.
Ole S Hansen@Ole_S_HansenFurther out along the curve, the positioning breakdown across the three main trader categories - Asset Managers, Leveraged Funds and Dealers (excluding the "Other Reportables" category) - looks as follows: 12:07 PM · Jun 14, 2026 · 2.29K Views1 Repost · 6 Likes
I think we are reaching local tops in both inflation prints and economic growth. I expect inflation to fall from the most recent readings and the fiscal impulse to soften as the OBBB tax incentives wear off. Q3 earnings season that begins in mid-July may start to show more of the consumer demand destruction that has taken place as a result of the Iran War.
In addition to the economic reasoning, I believe a Warsh- (and Bessent for that matter) led Fed will prefer using the rate cut channel over the balance sheet support channel to effectuate monetary policy, a change from the recent Powell years. Ultimately this should lead to a steeper yield curve, healthier banking system and more balanced economy. It may take some time and possible market hiccups for that to play out given the requirement of shifting the committee’s consensus around to those views, but I think it will happen.


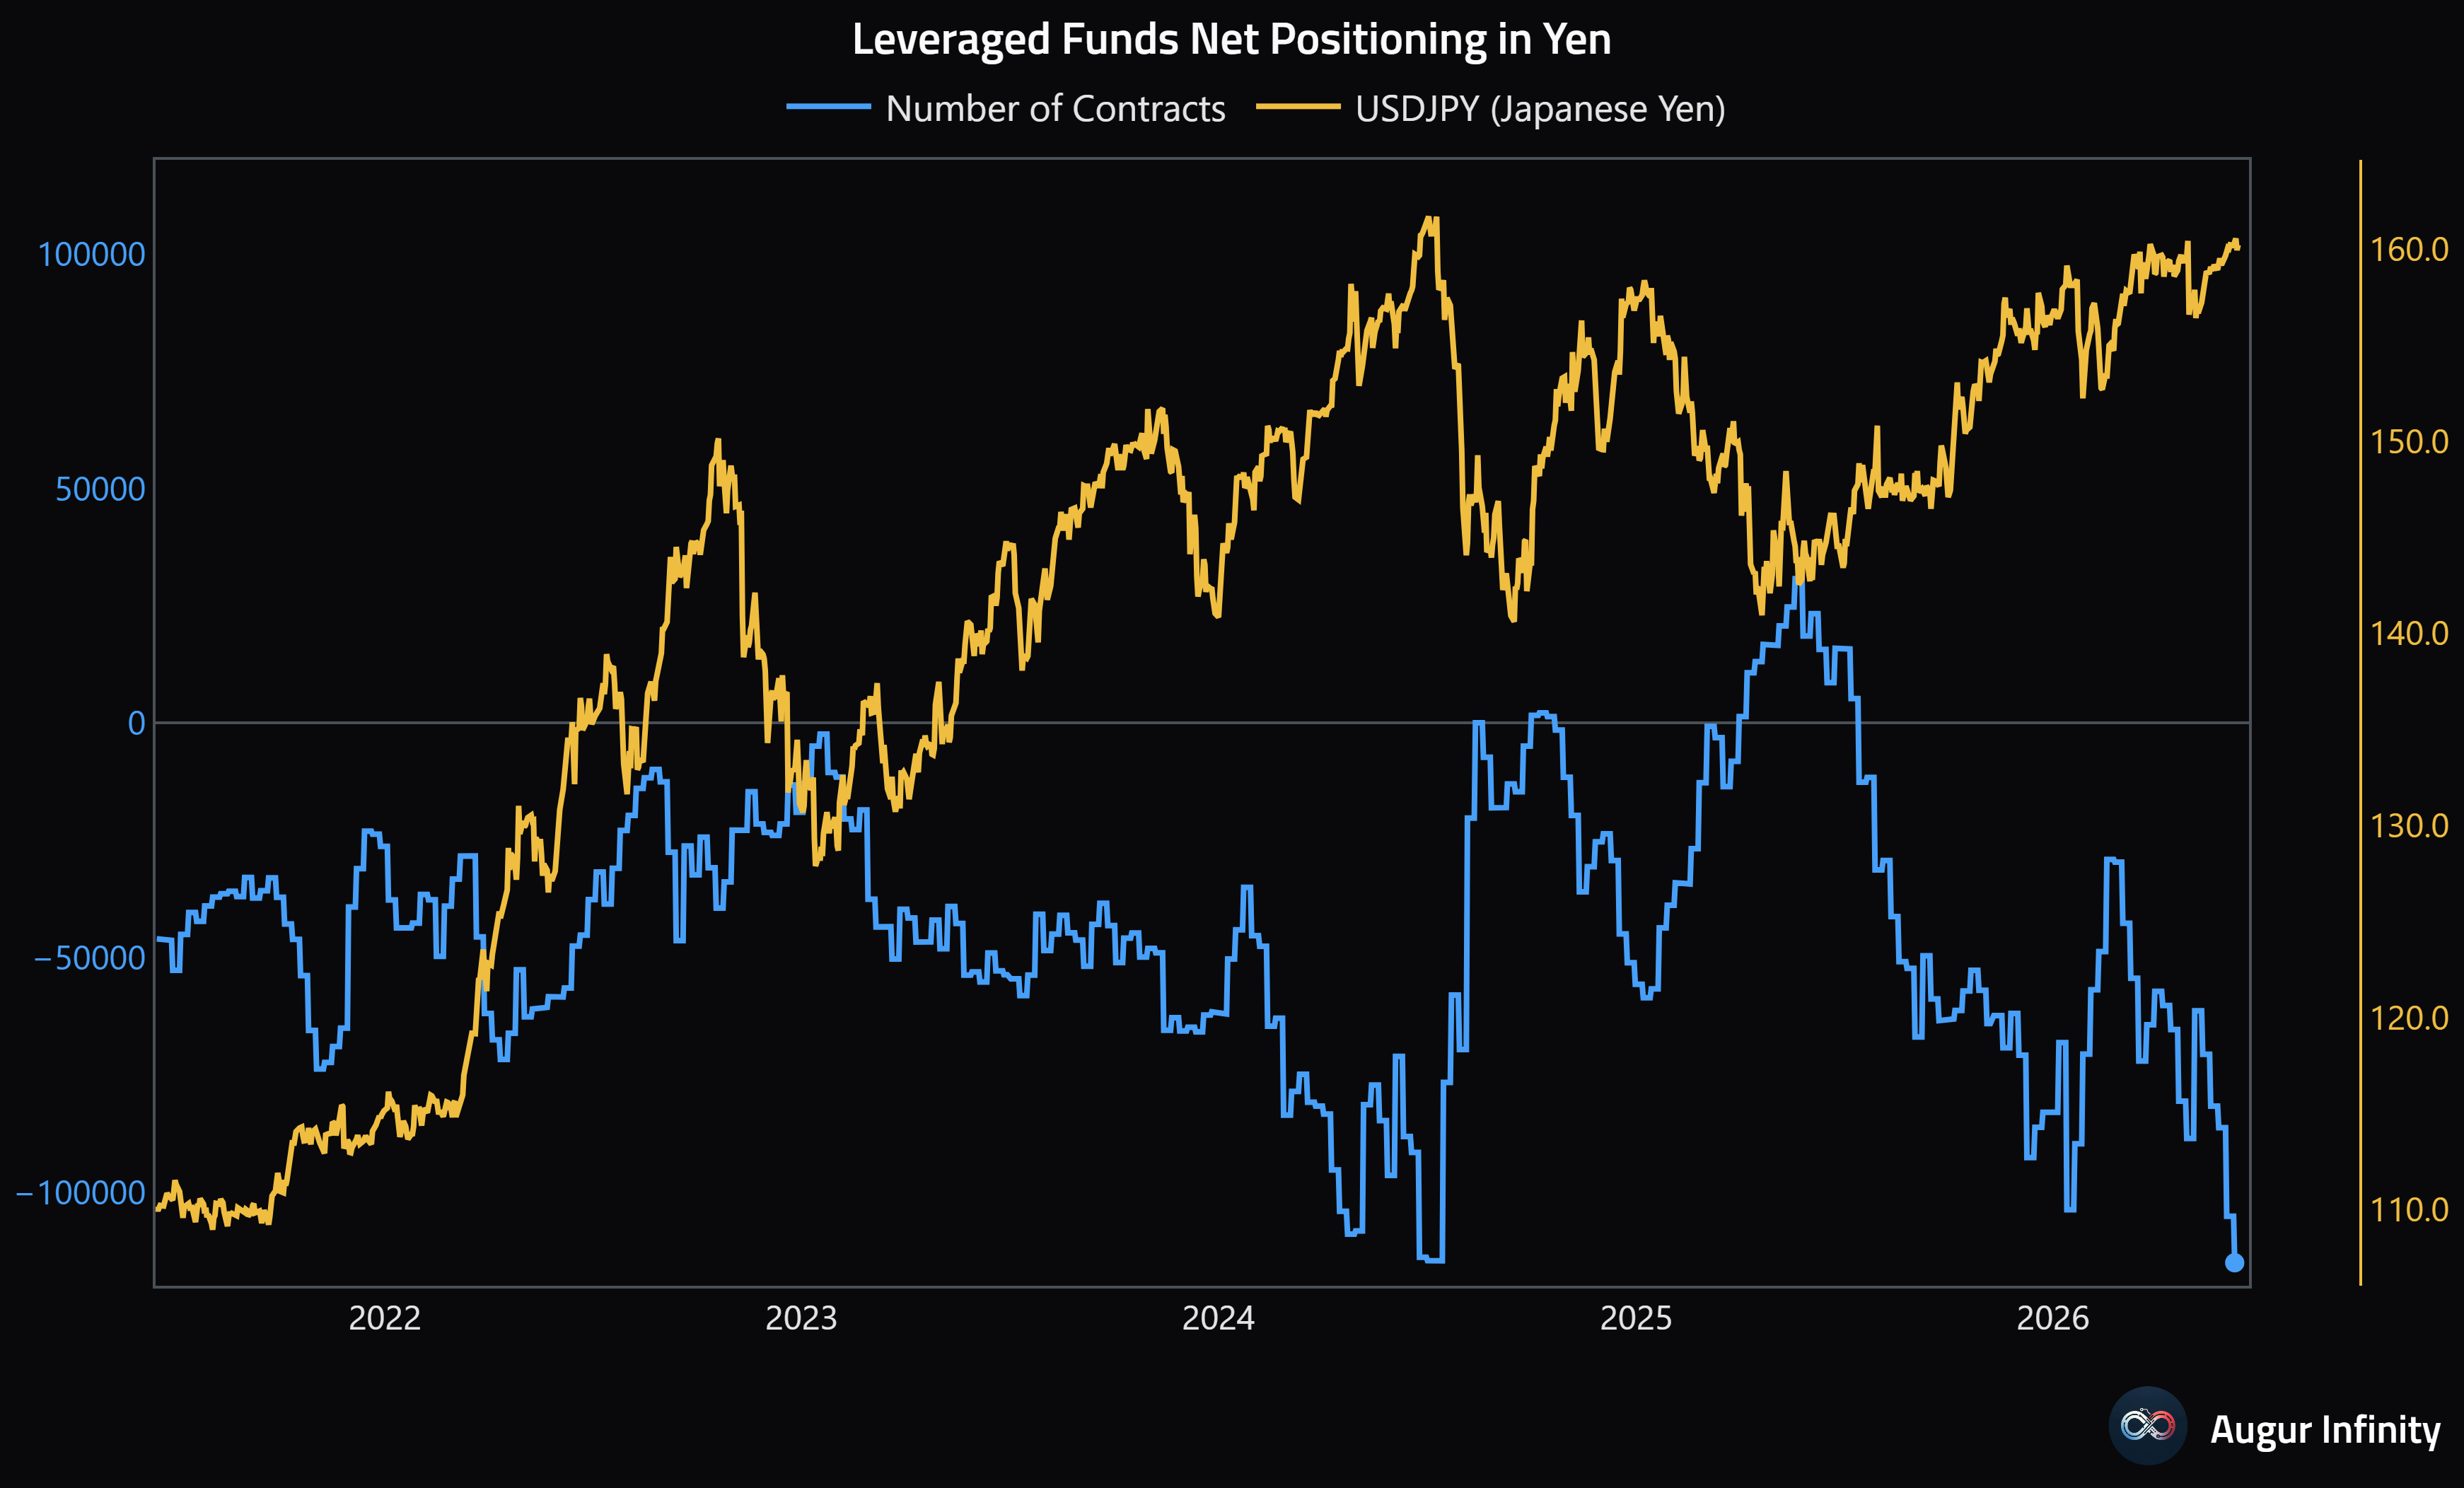
Yen shorts are very crowded.
Another topic you’re probably sick of hearing about from me, but I’ll only shut up about it when it stops being relevant. What happened this week just before Trump announced the Iran deal on Thursday? USDJPY was pressing above 160. That is not a coincidence.
This week USDJPY closed almost exactly where it did last week and it is becoming more and more relevant. Why?
There’s a BOJ meeting on Tuesday, just before the FOMC and Warsh’s first press conference on Wednesday.
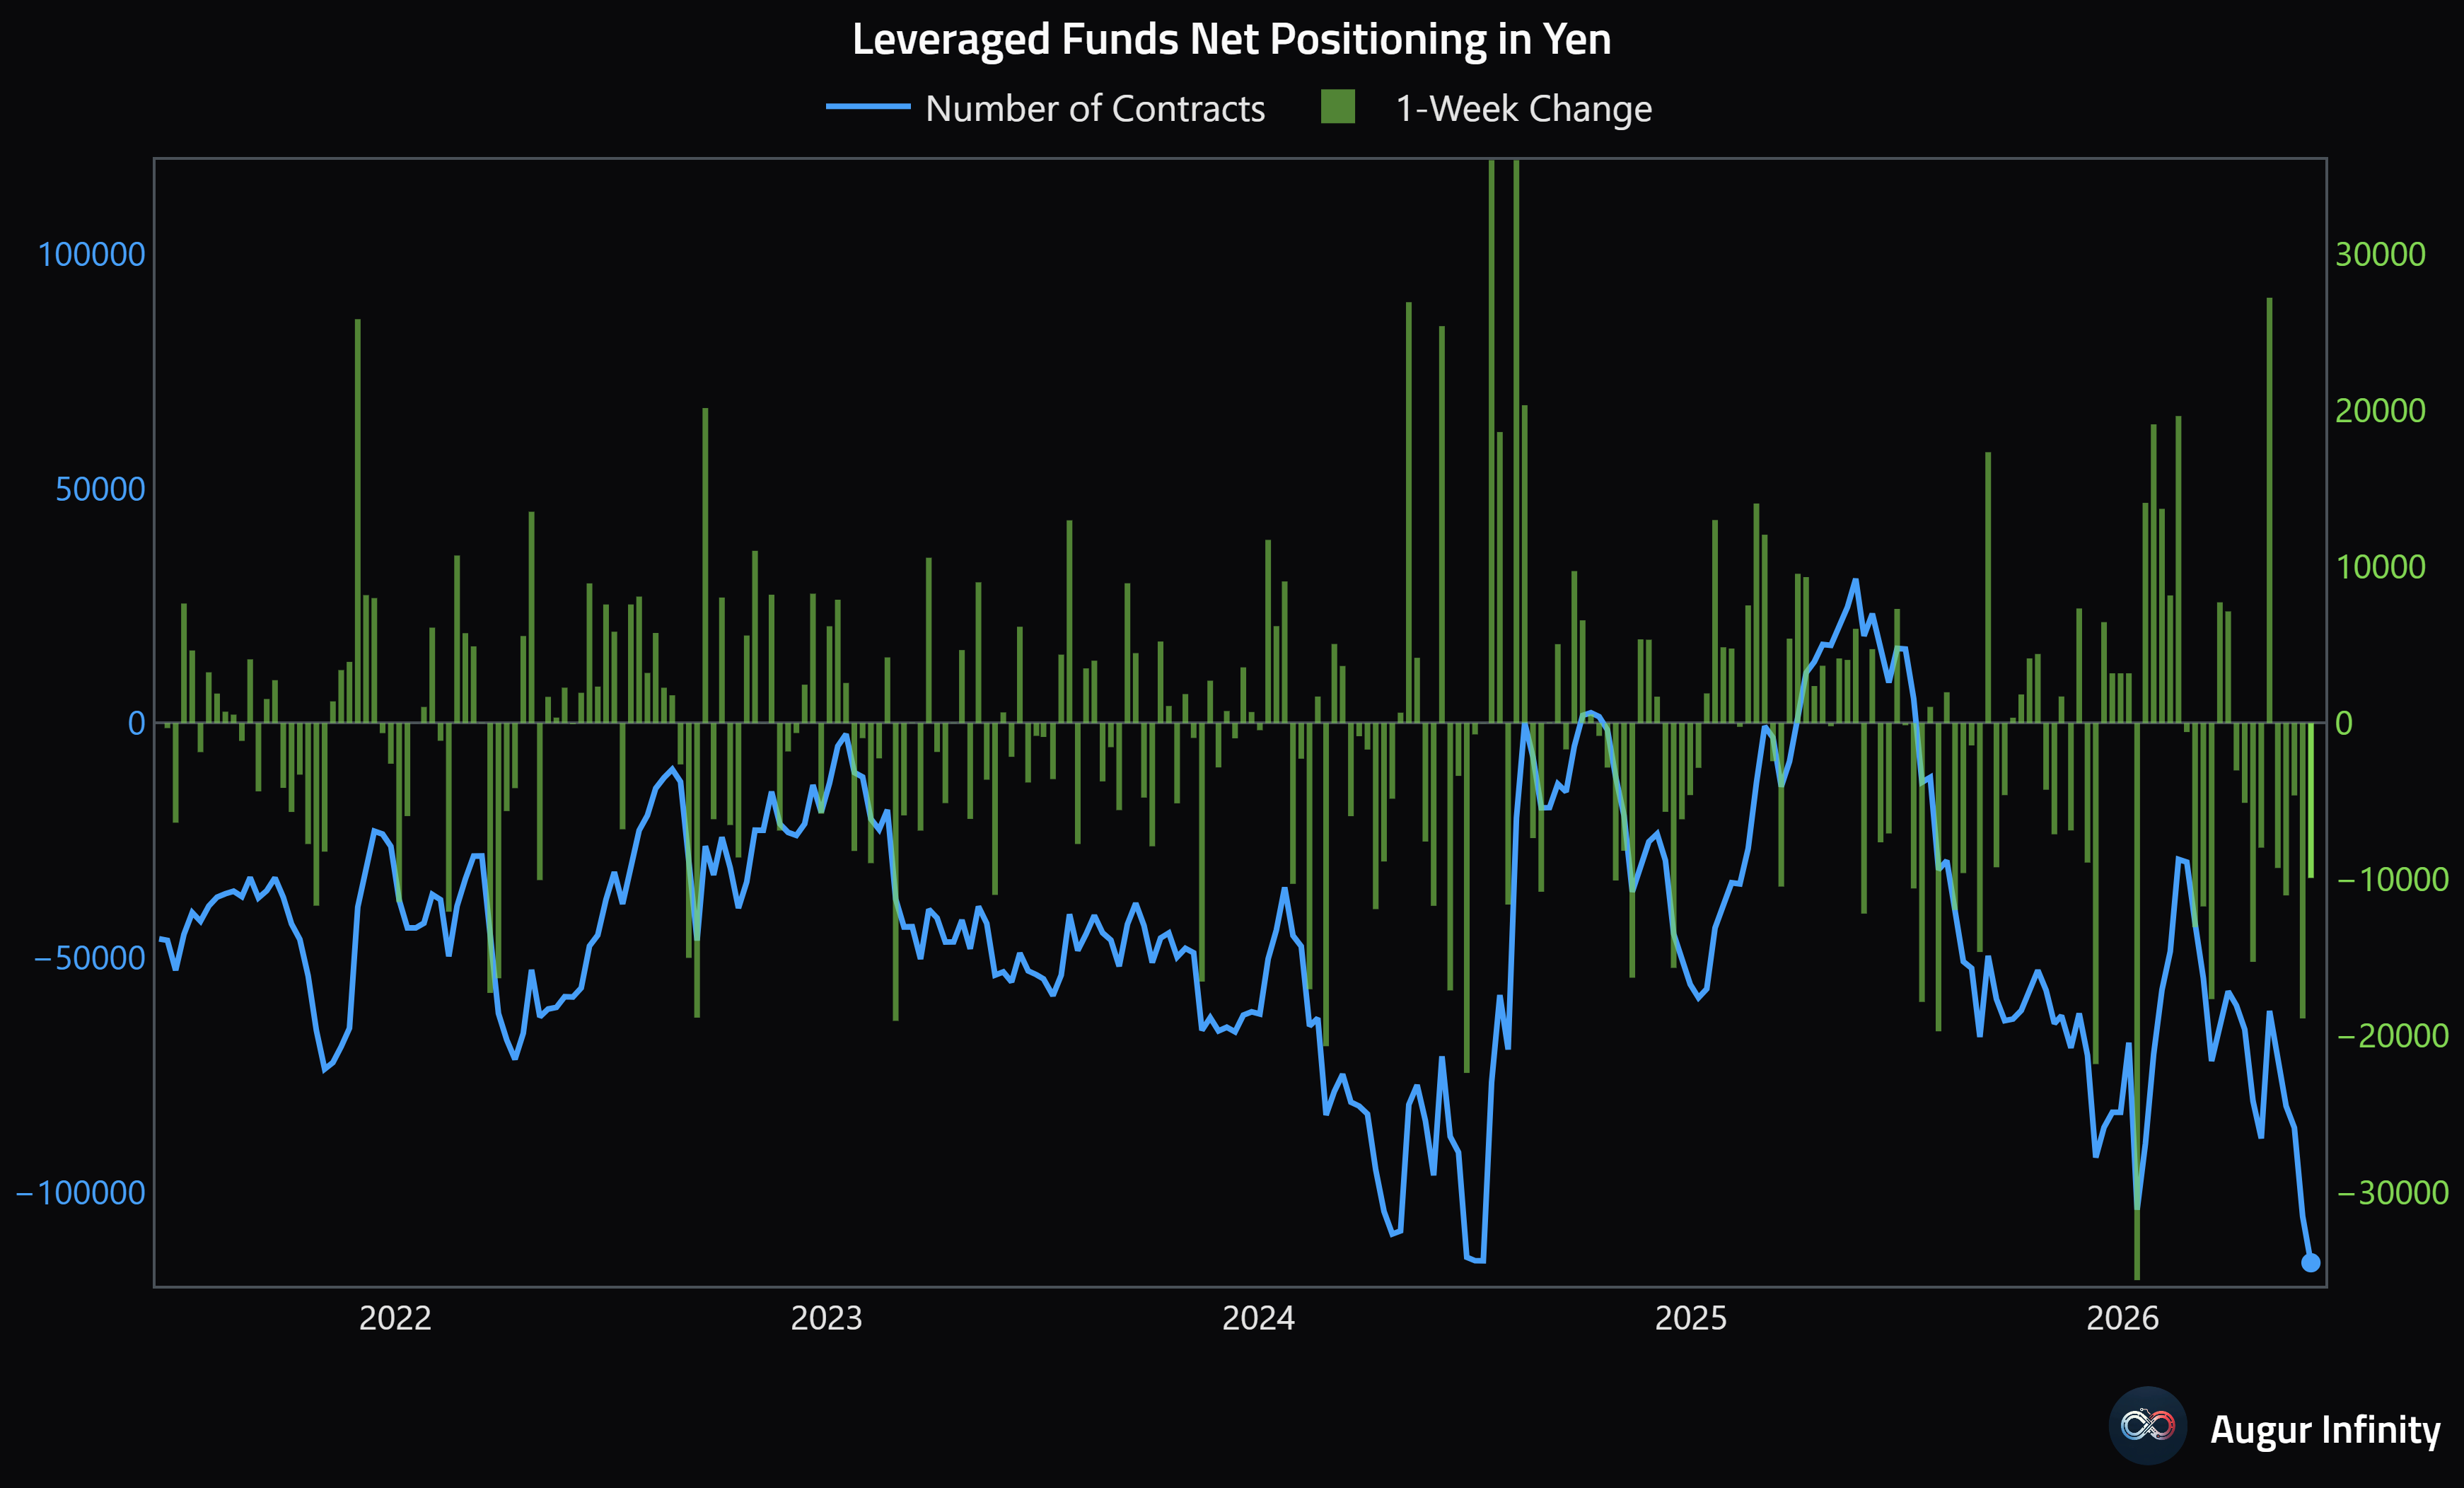
Here’s the big one. Yen short contracts are back to their highest level since 2017, and basically equivalent to the positioning just before the 2024 Yen carry unwind.
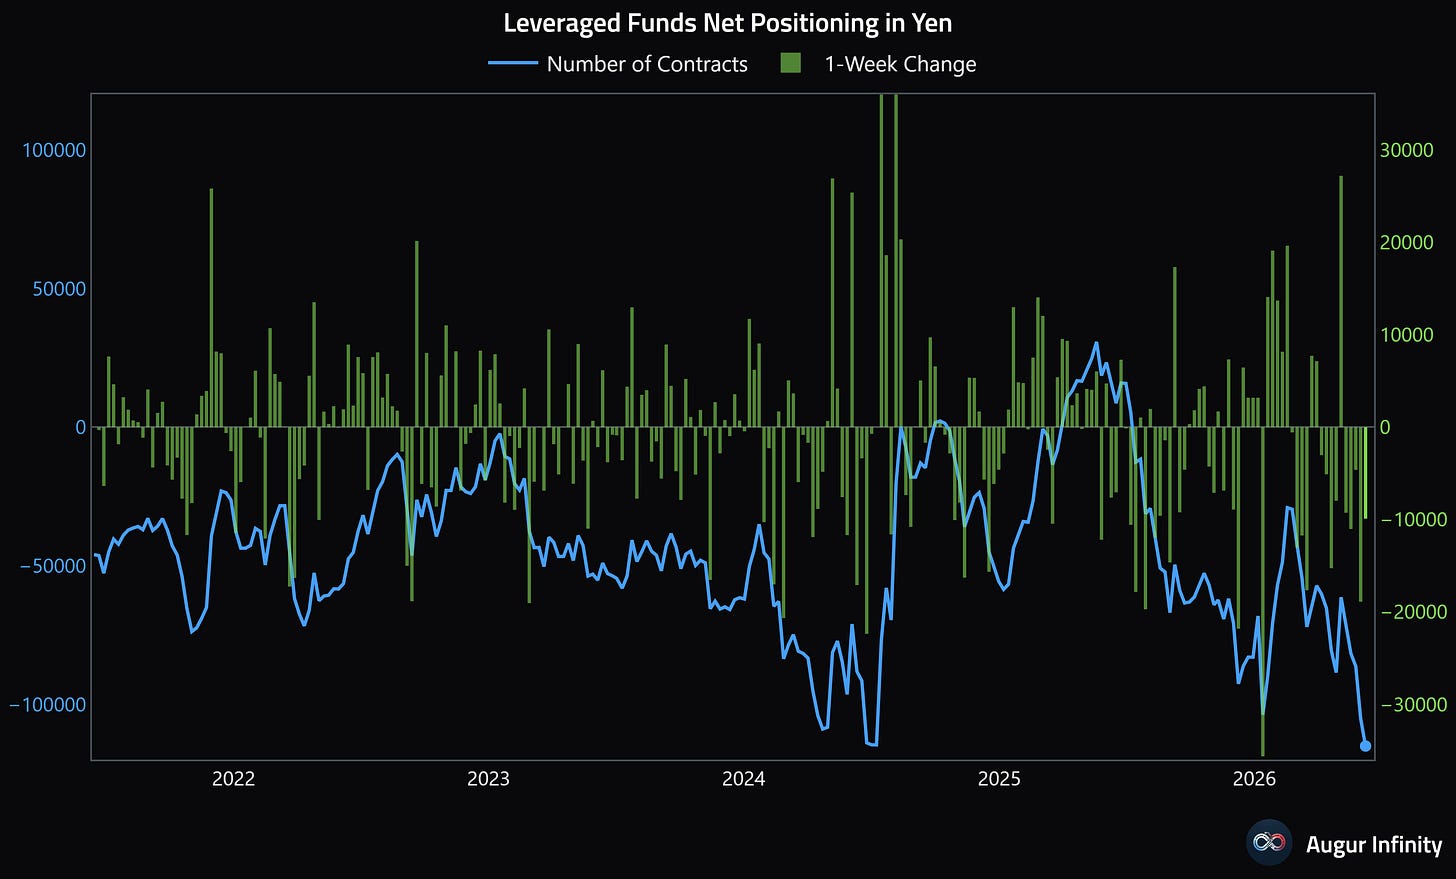
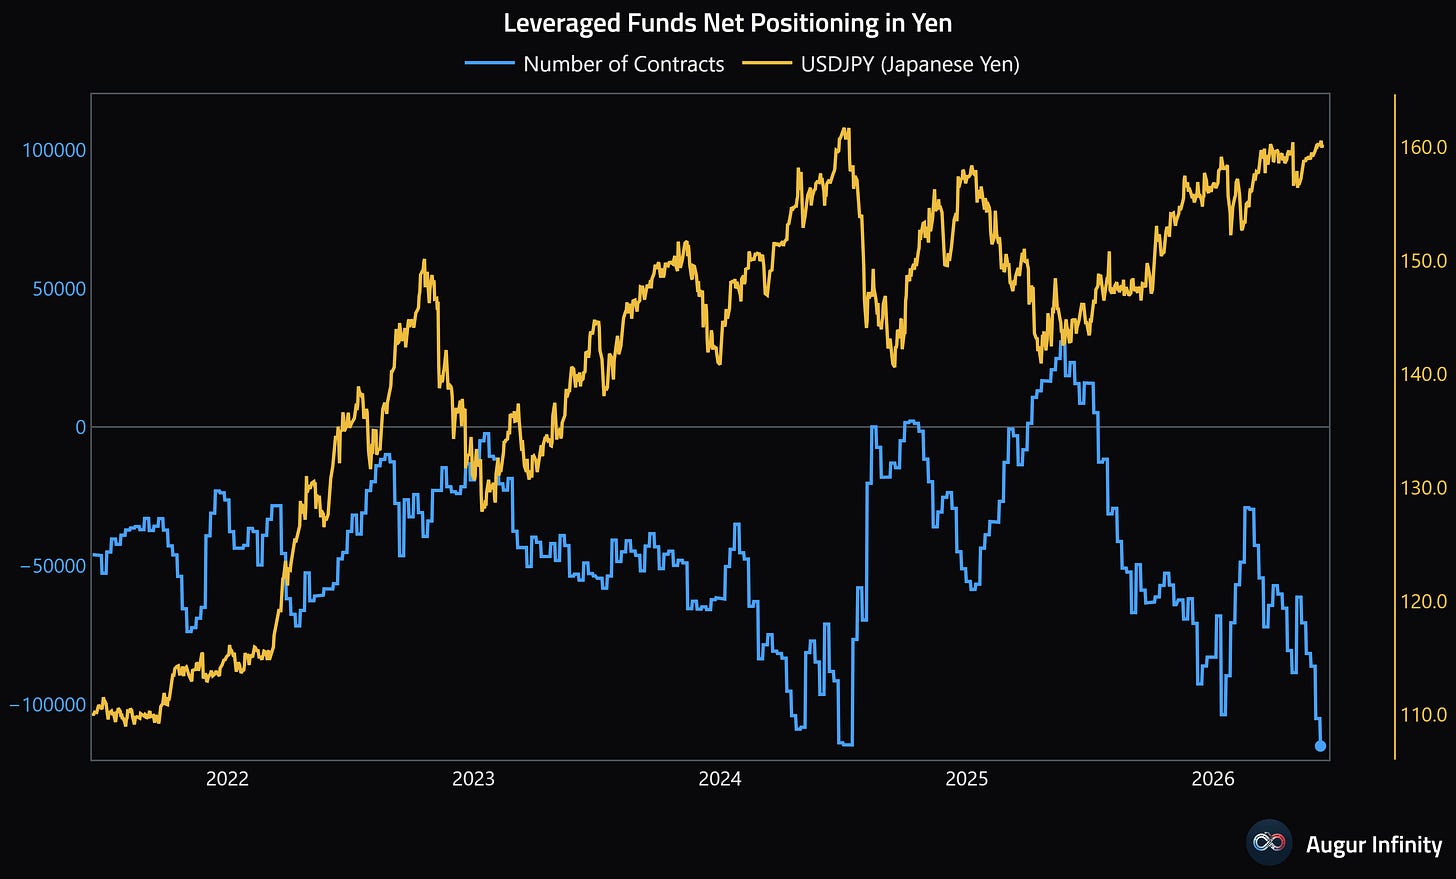
So the question is how does this resolve? You have USDJPY sitting at a critical 160 level that Japanese policymakers don’t want to see breached at the same time Yen shorts are at record highs. One would imagine the conditions for a squeeze are there. My view remains that they will be forced to let the 160 level go eventually as the problems plaguing Japan’s fiscal and monetary health are just too great. But that said, I think they will not give record shorts a free ride and instead try to make one last good hard stand first.
In an attempt to take the other side, maybe there’s an acceptable outcome here for risk whereby USDJPY is brought down in a managed, non-volatile way via more dovish Fed policy that weakens the dollar relative to the Yen. I also could be wrong about the 160 level and maybe policymakers just let the Yen continue weakening, but that means stronger dollar which could still be a headwind for risk. We will find out more next week after both central bank meetings.
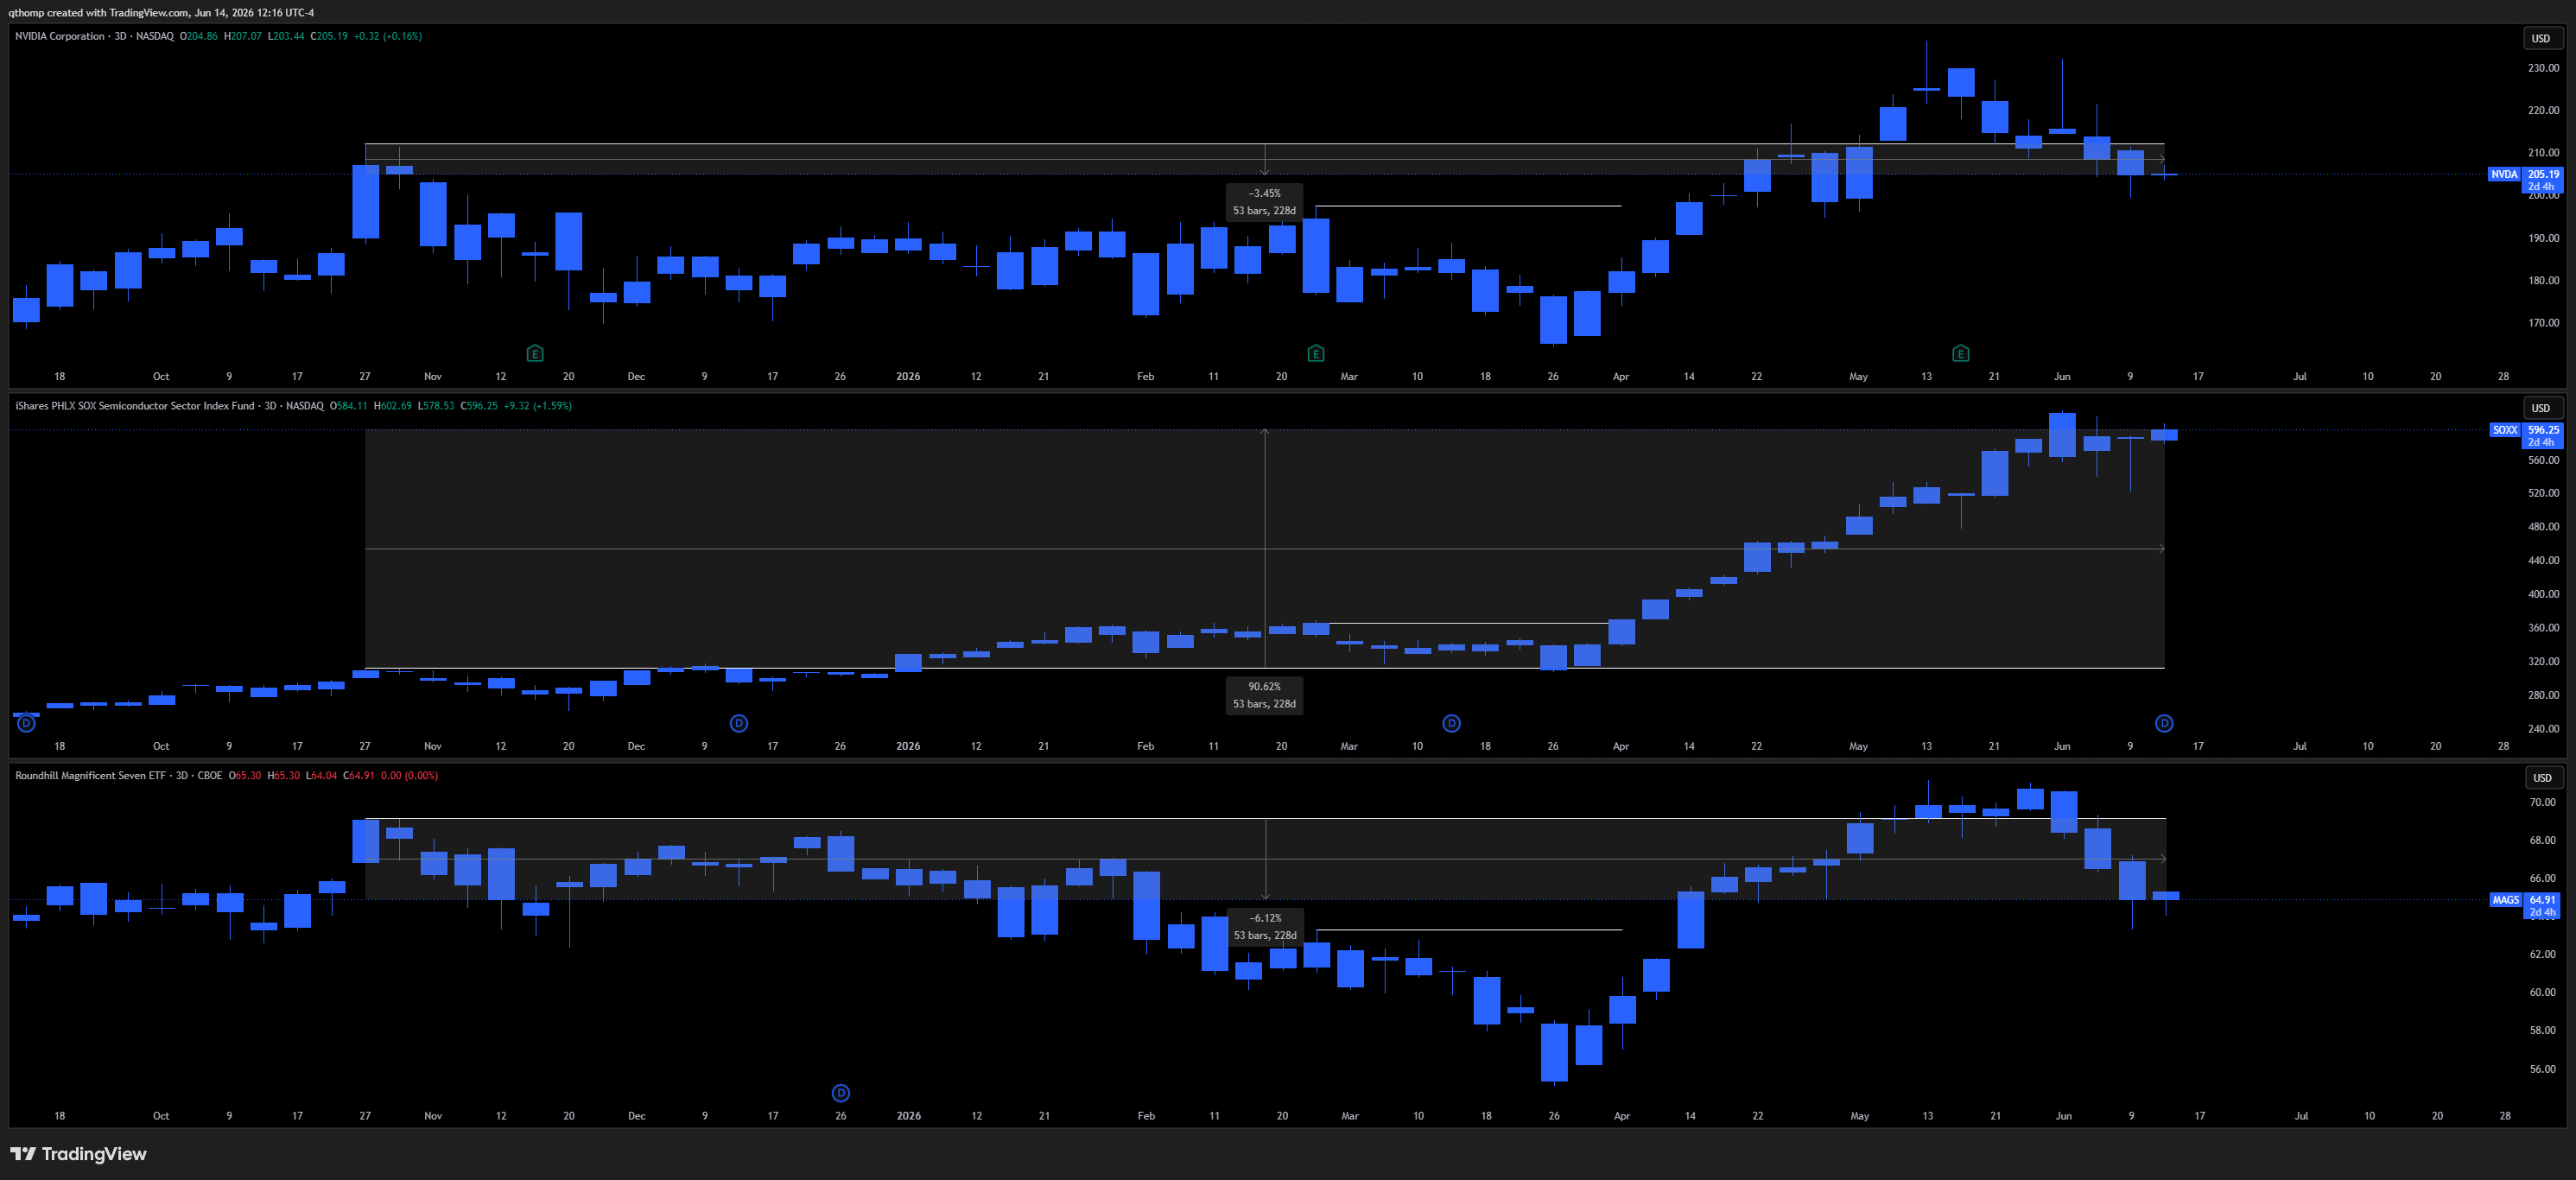
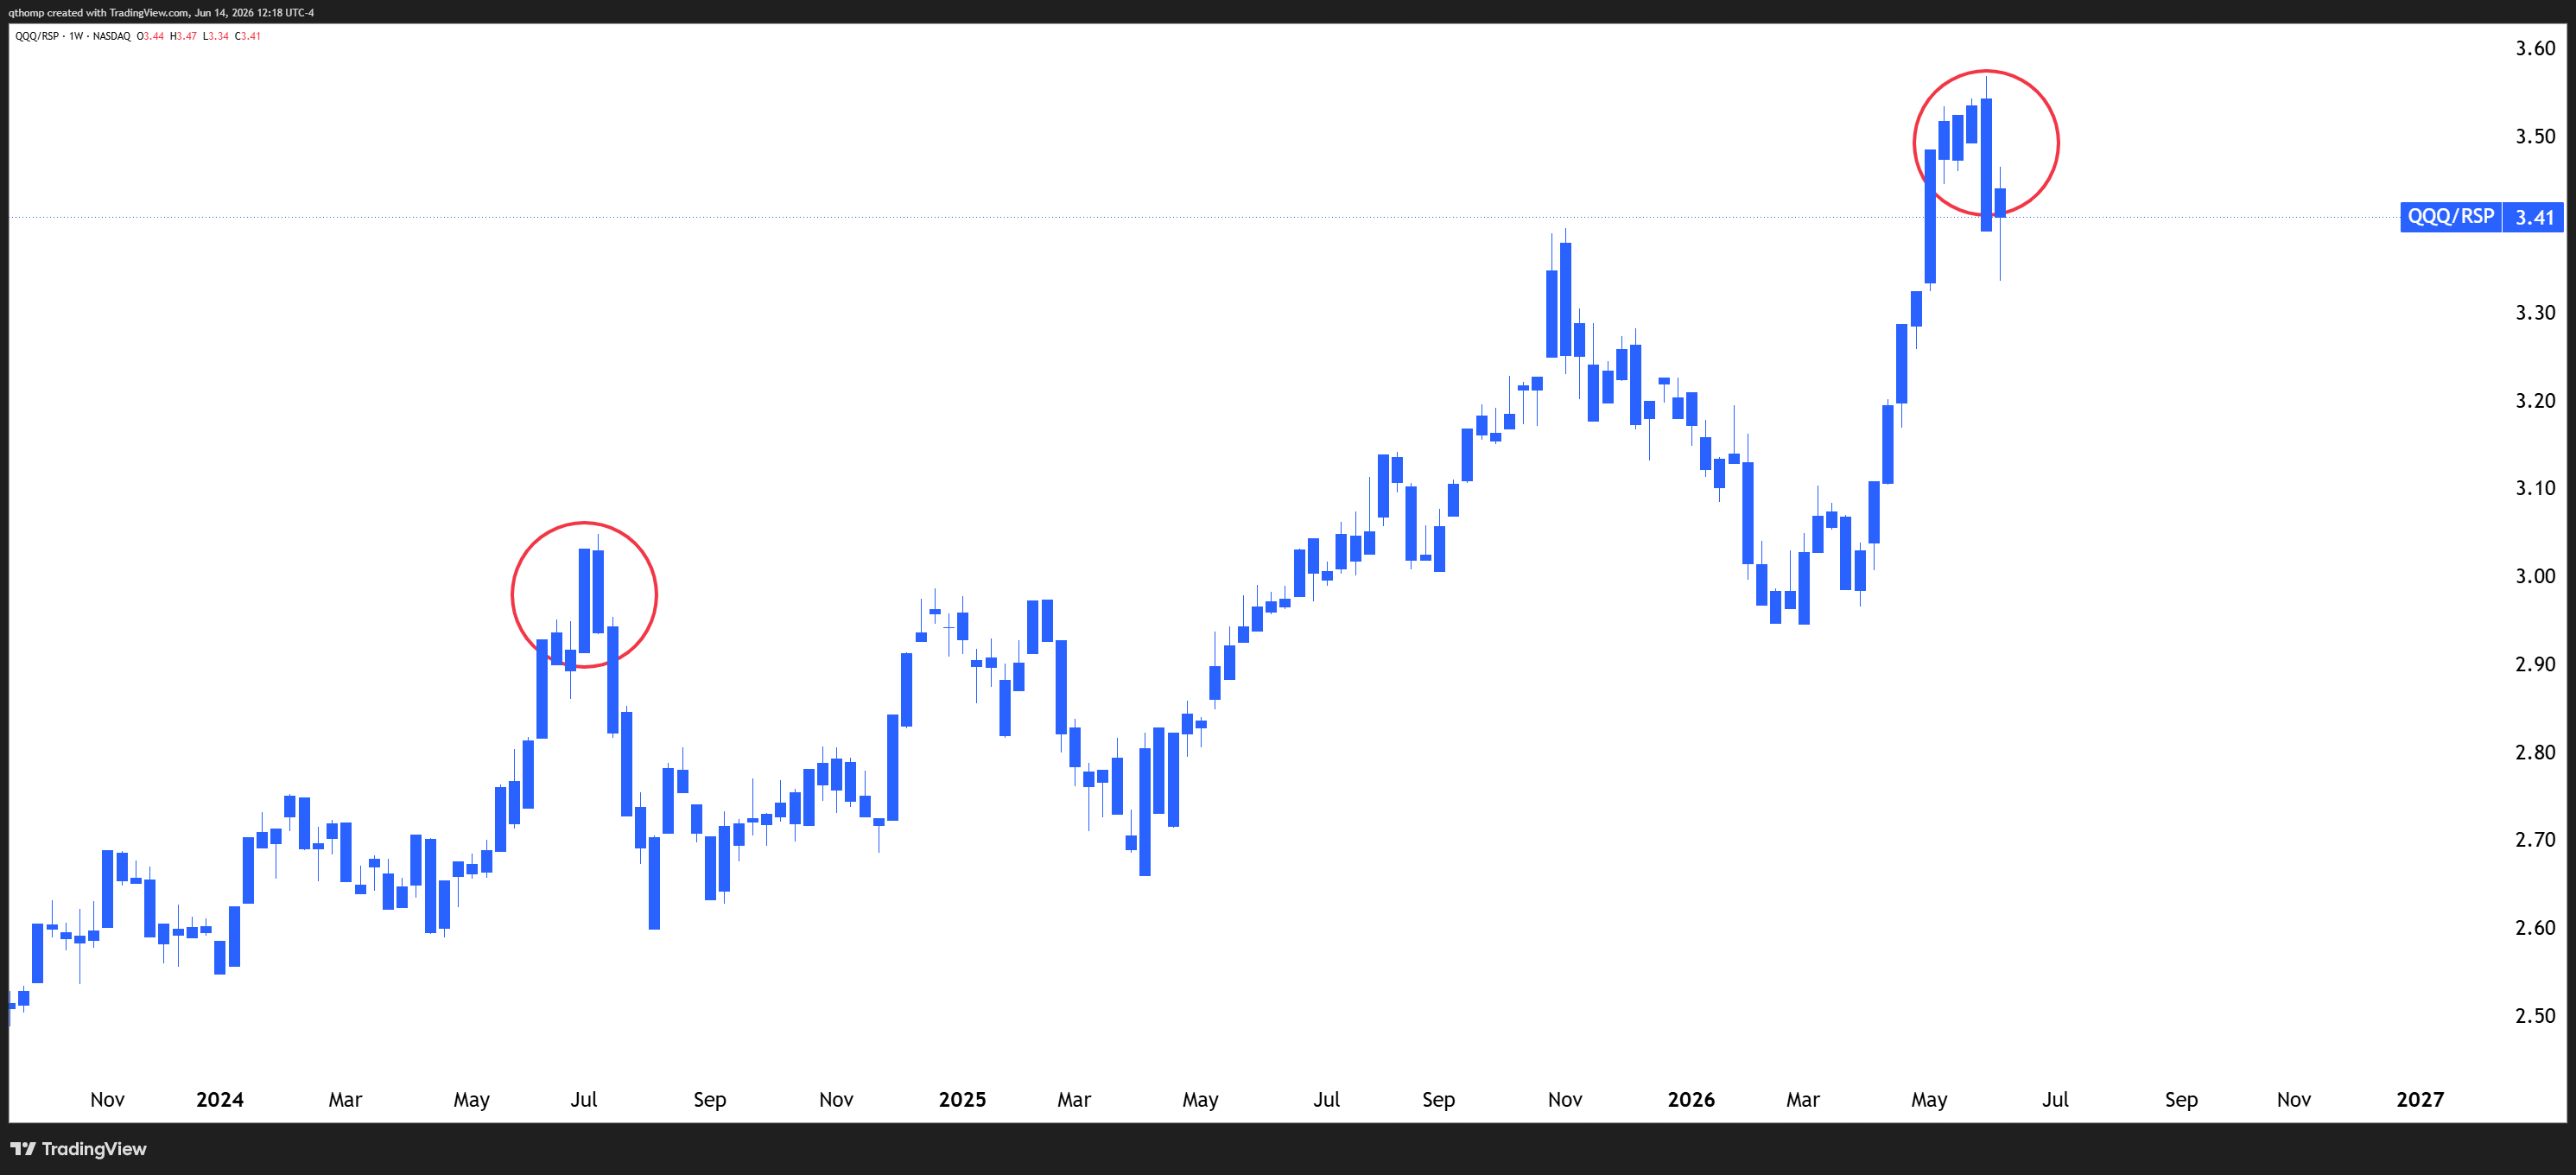
Revisiting the NVDA vs. SOXX vs. Mag7 divergence.
We flagged this interesting dynamic back in April as something to watch. I was a bit early at the time but what I highlighted has started to pan out further. Since the late October 2025 Nasdaq high, semiconductors are +90%, NVDA is -3% and MAGS is -6%.
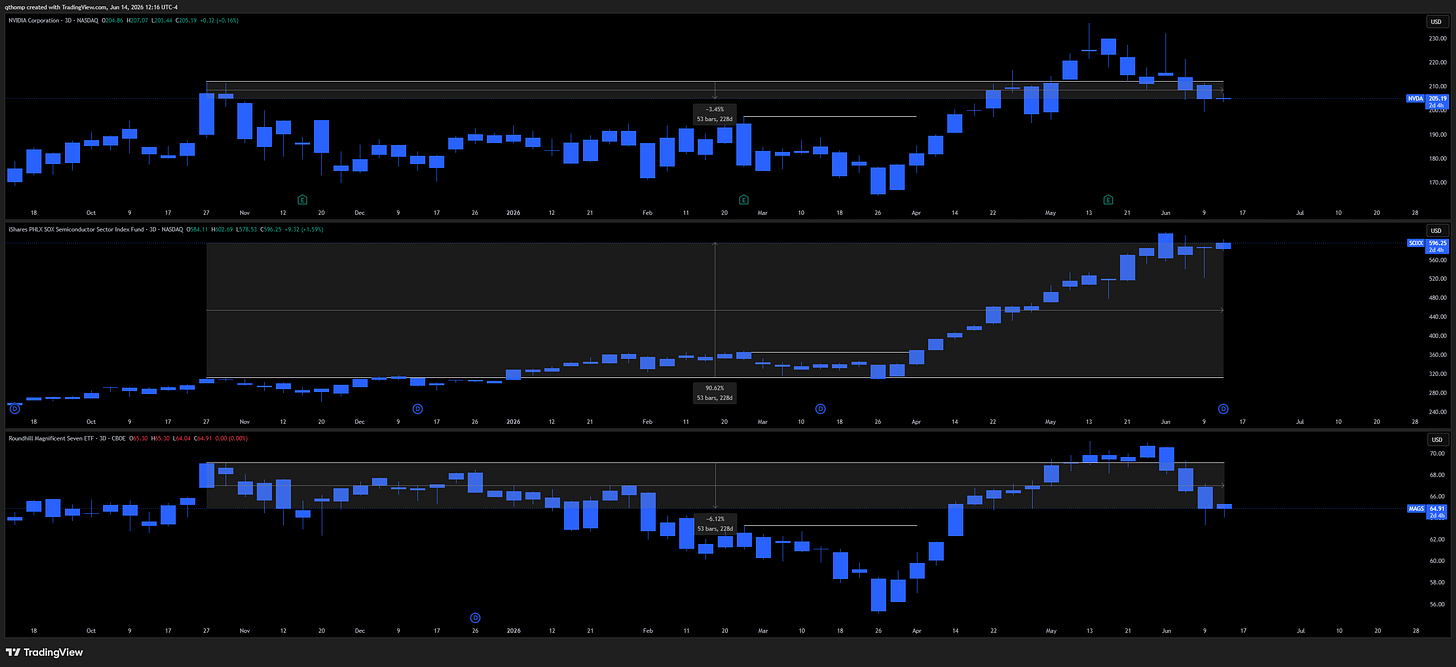
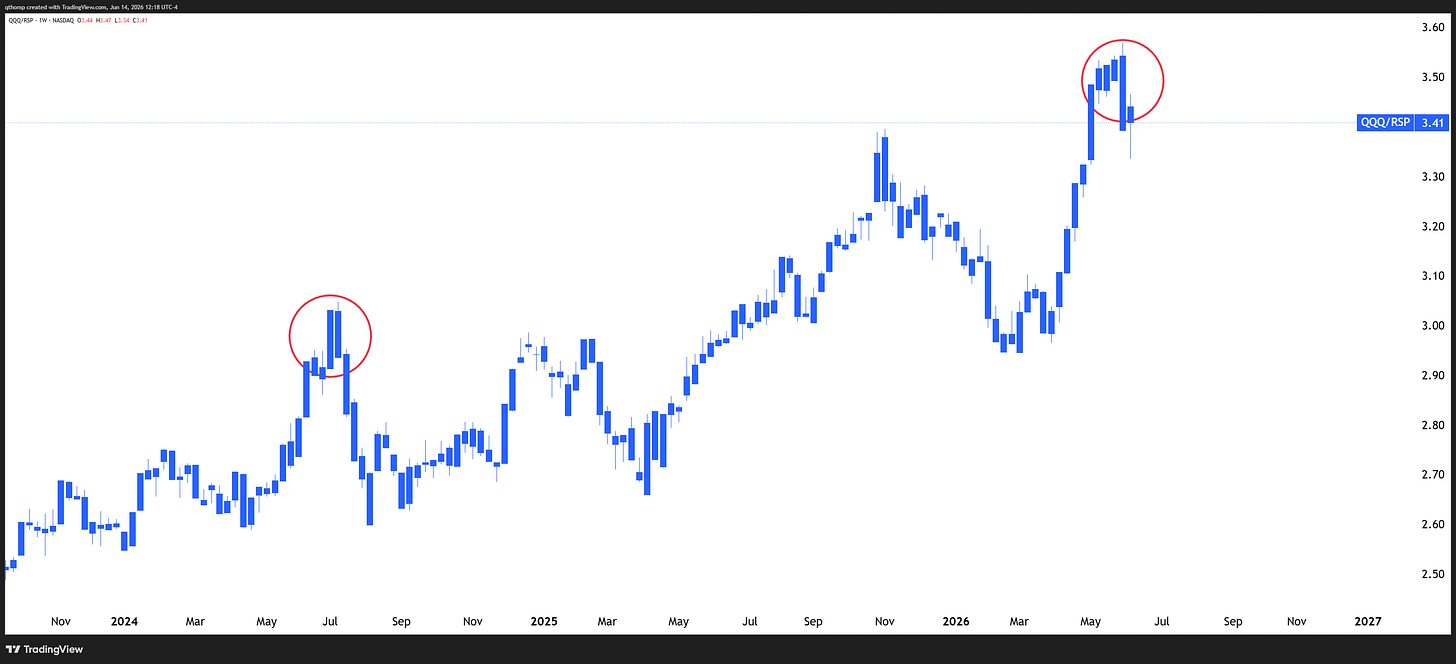
This blow off top in tech, particularly momentum and semiconductors, is another thing giving me July 2024 vibes. Maybe the strength doesn’t end here and lasts into July, definitely not saying it has to end right this second, but we’re getting closer to a top that is for sure.
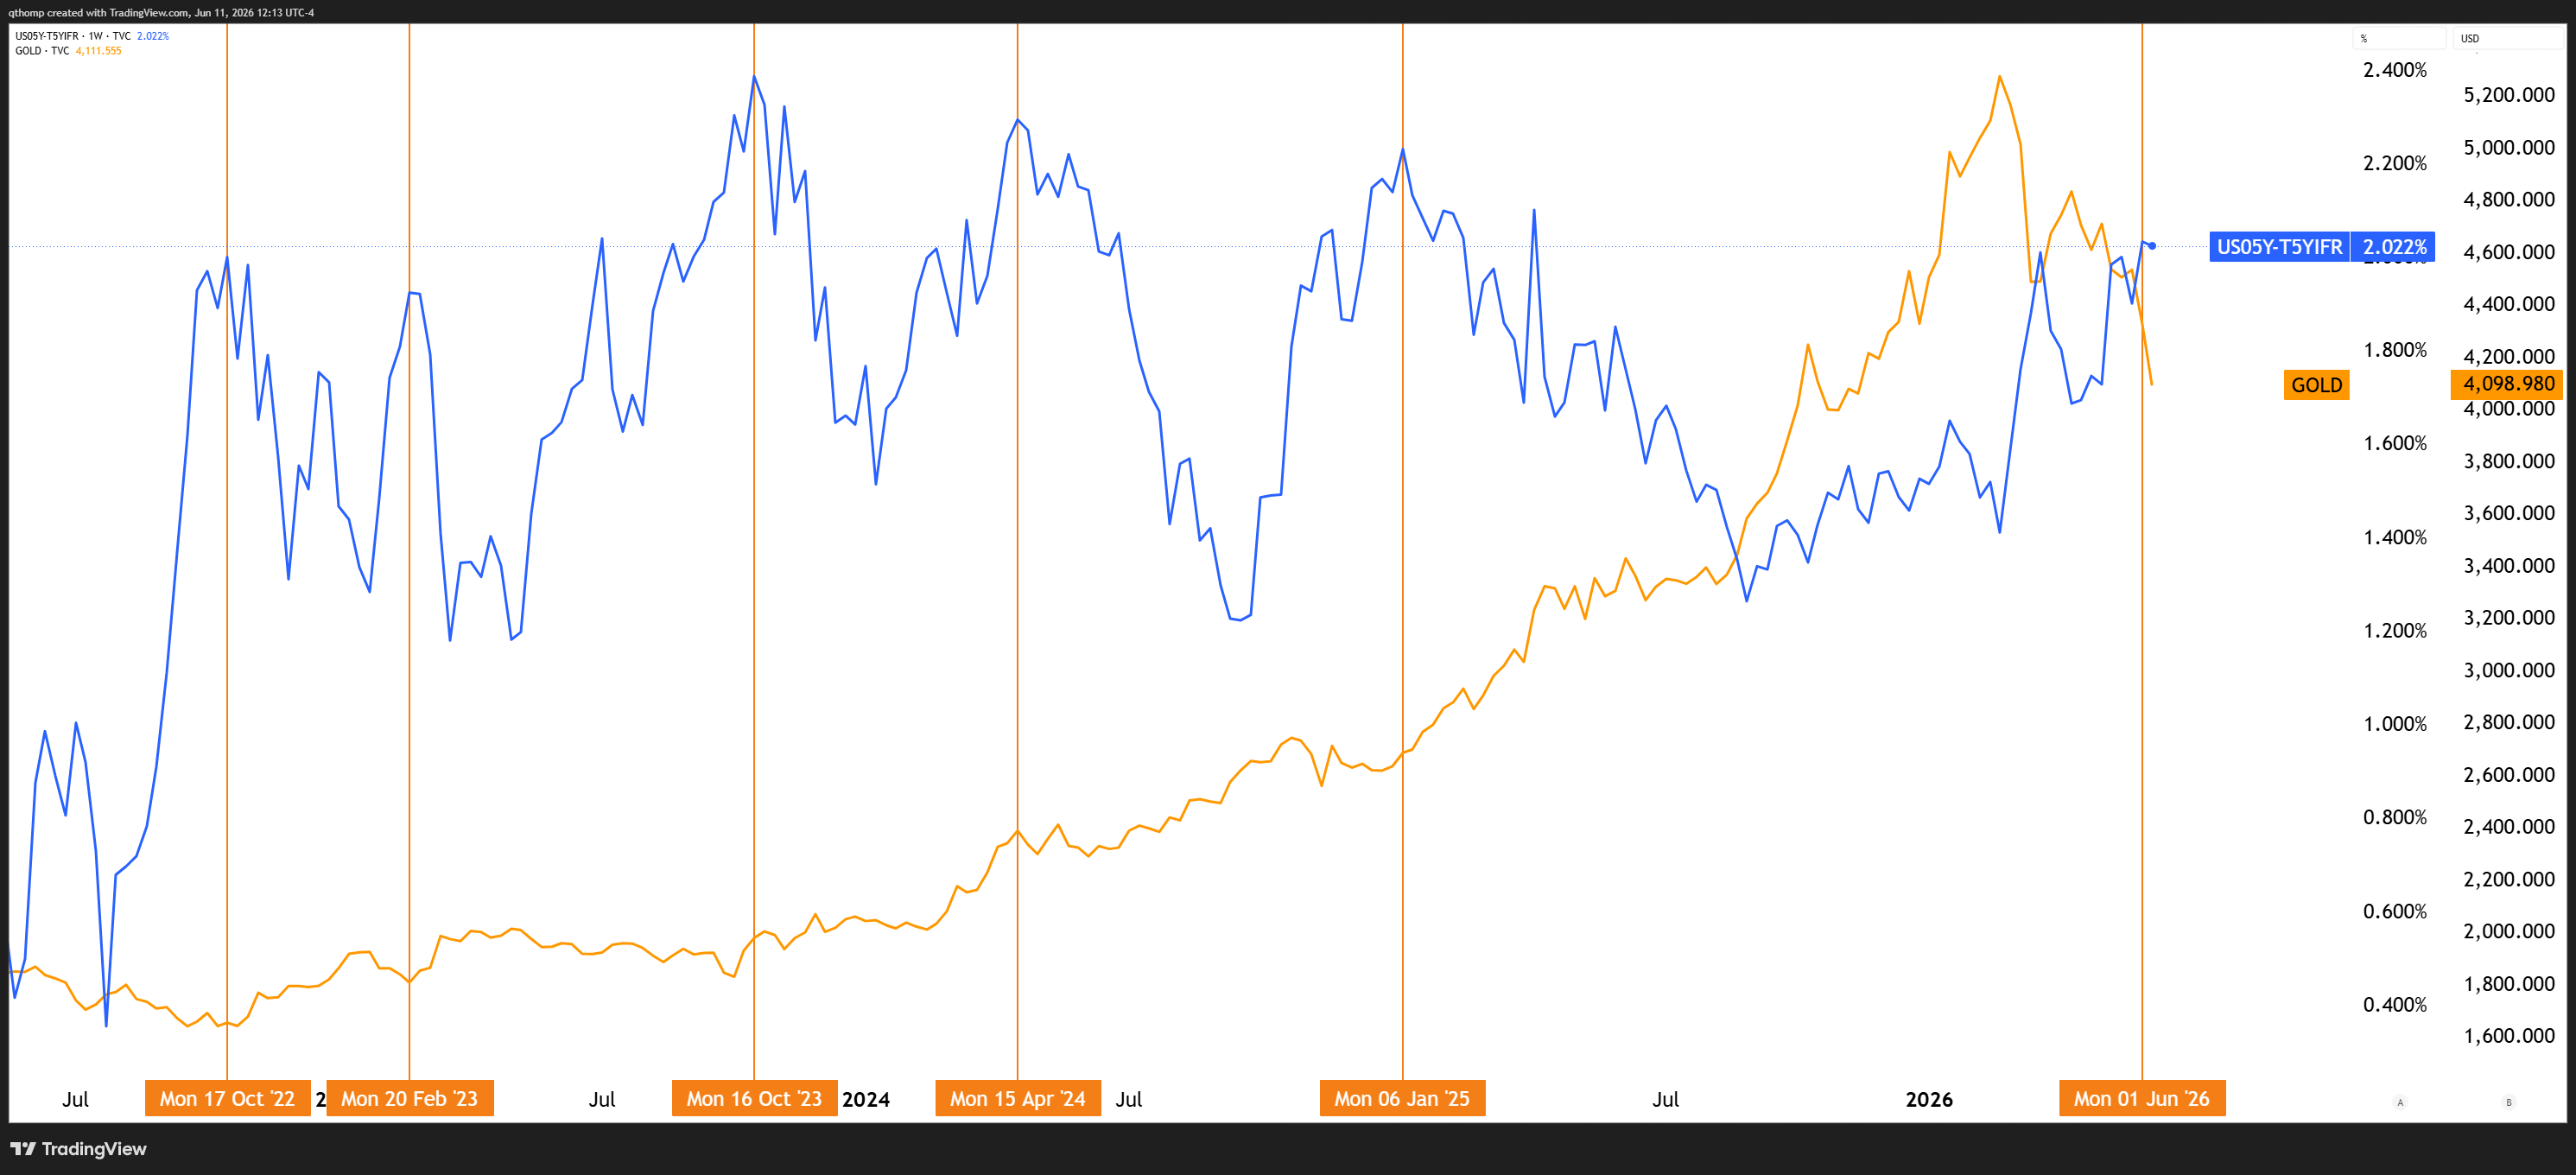
Gold is starting to look attractive.
Given my view that SOFR futures are bottoming, USDJPY is topping and real rates are peaking, that’s about as simple of a summary that’s needed to paint the bull case for gold.

Positioning data also supports the idea given capitulatory ETF outflows, large decline in futures open interest and option skew reaching extreme put heavy demand (contrarian bearish indicator).
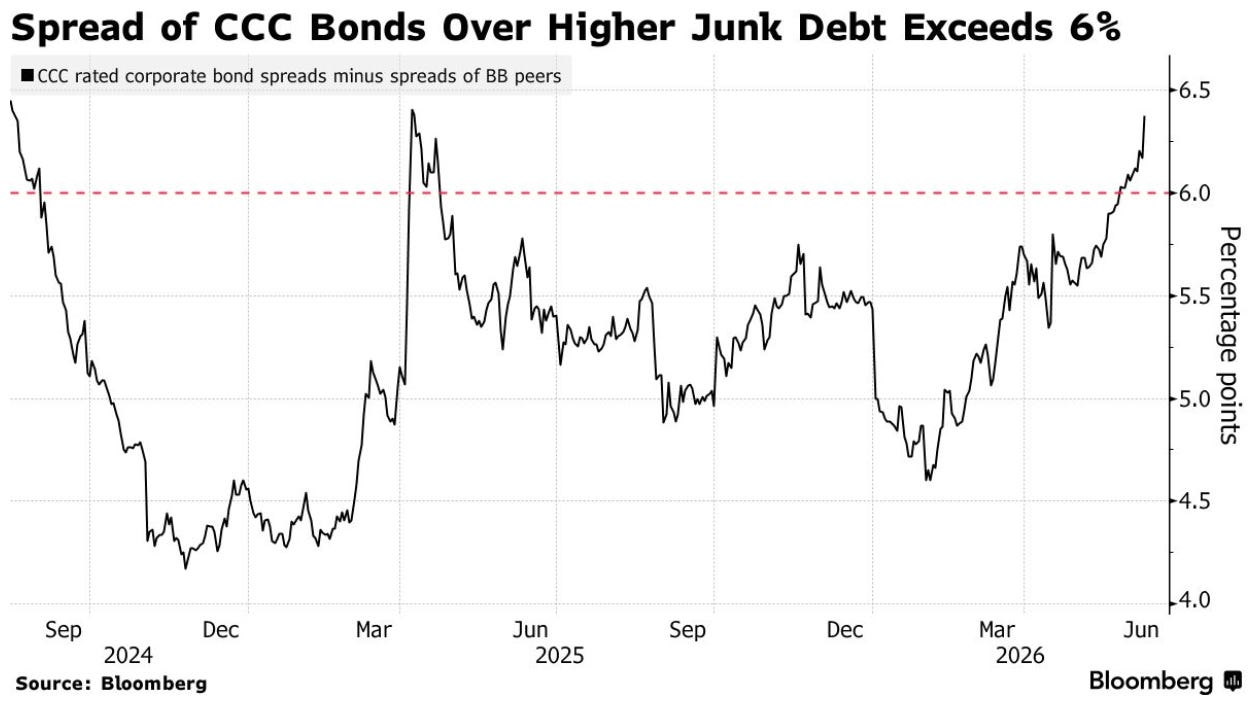
Does Bloomberg read Scouting the Tape?
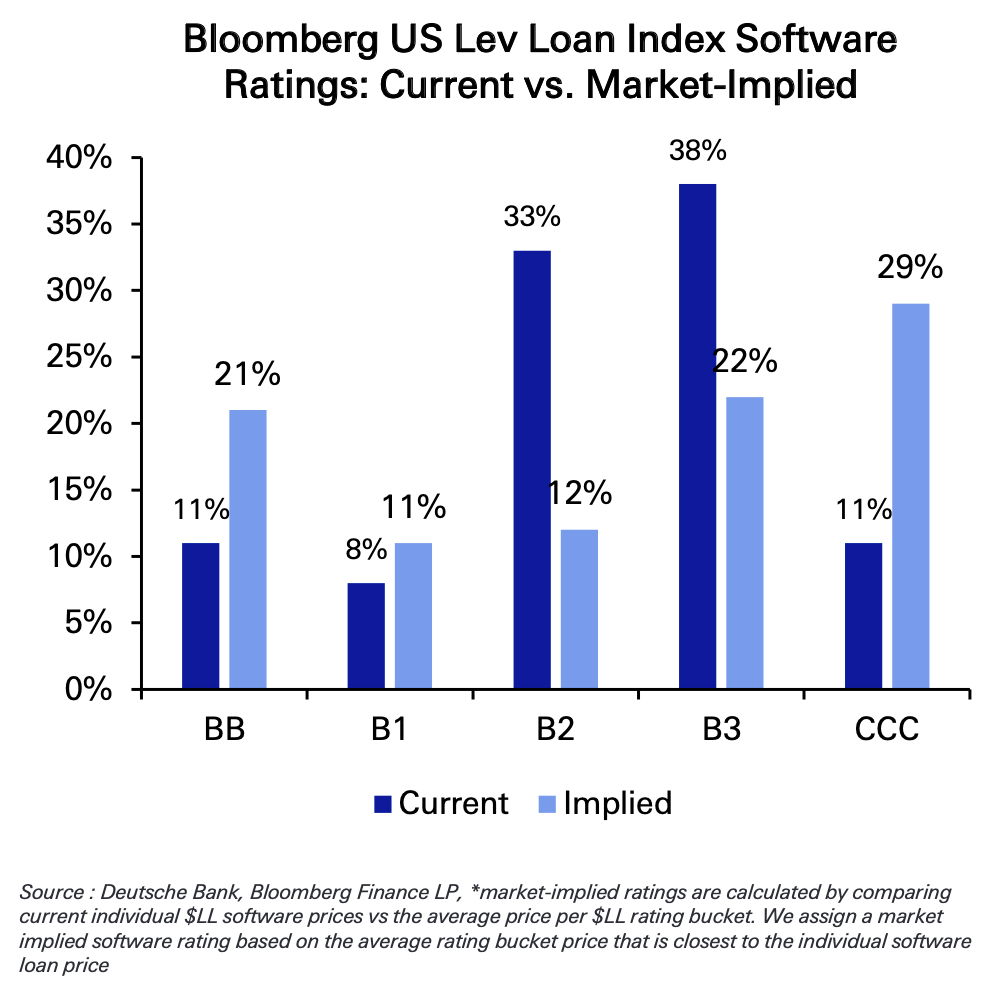
A few weeks ago we wrote about the widening spread in C-rated junkier parts of the credit market relative to B-rated paper. This pasts week Bloomberg has also started to pick up on this trend.

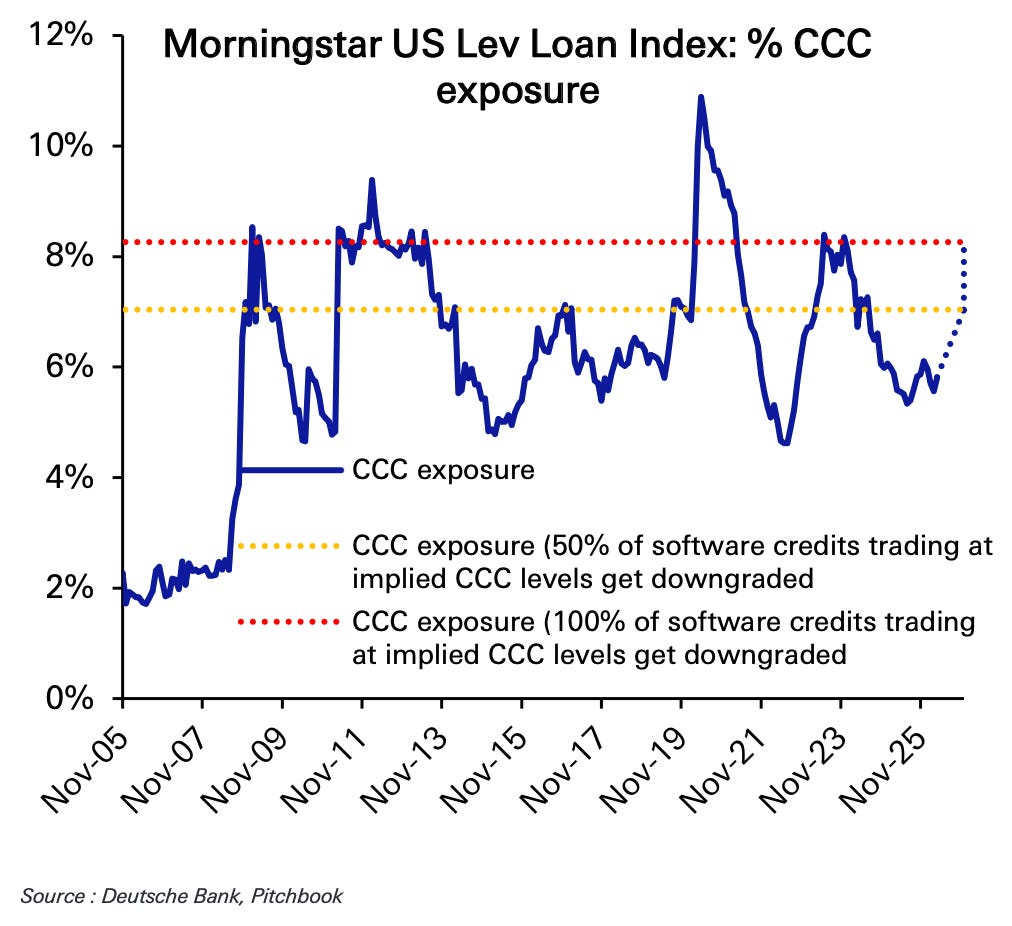
DB had a report out showing a lot of the carnage is software-related and that if ratings were to adjust accordingly, the share of CCC-rated debt in the US Leveraged Loan index would increase substantially.


It’s no surprise then that private credit redemption requests and fund gates continue to increase.
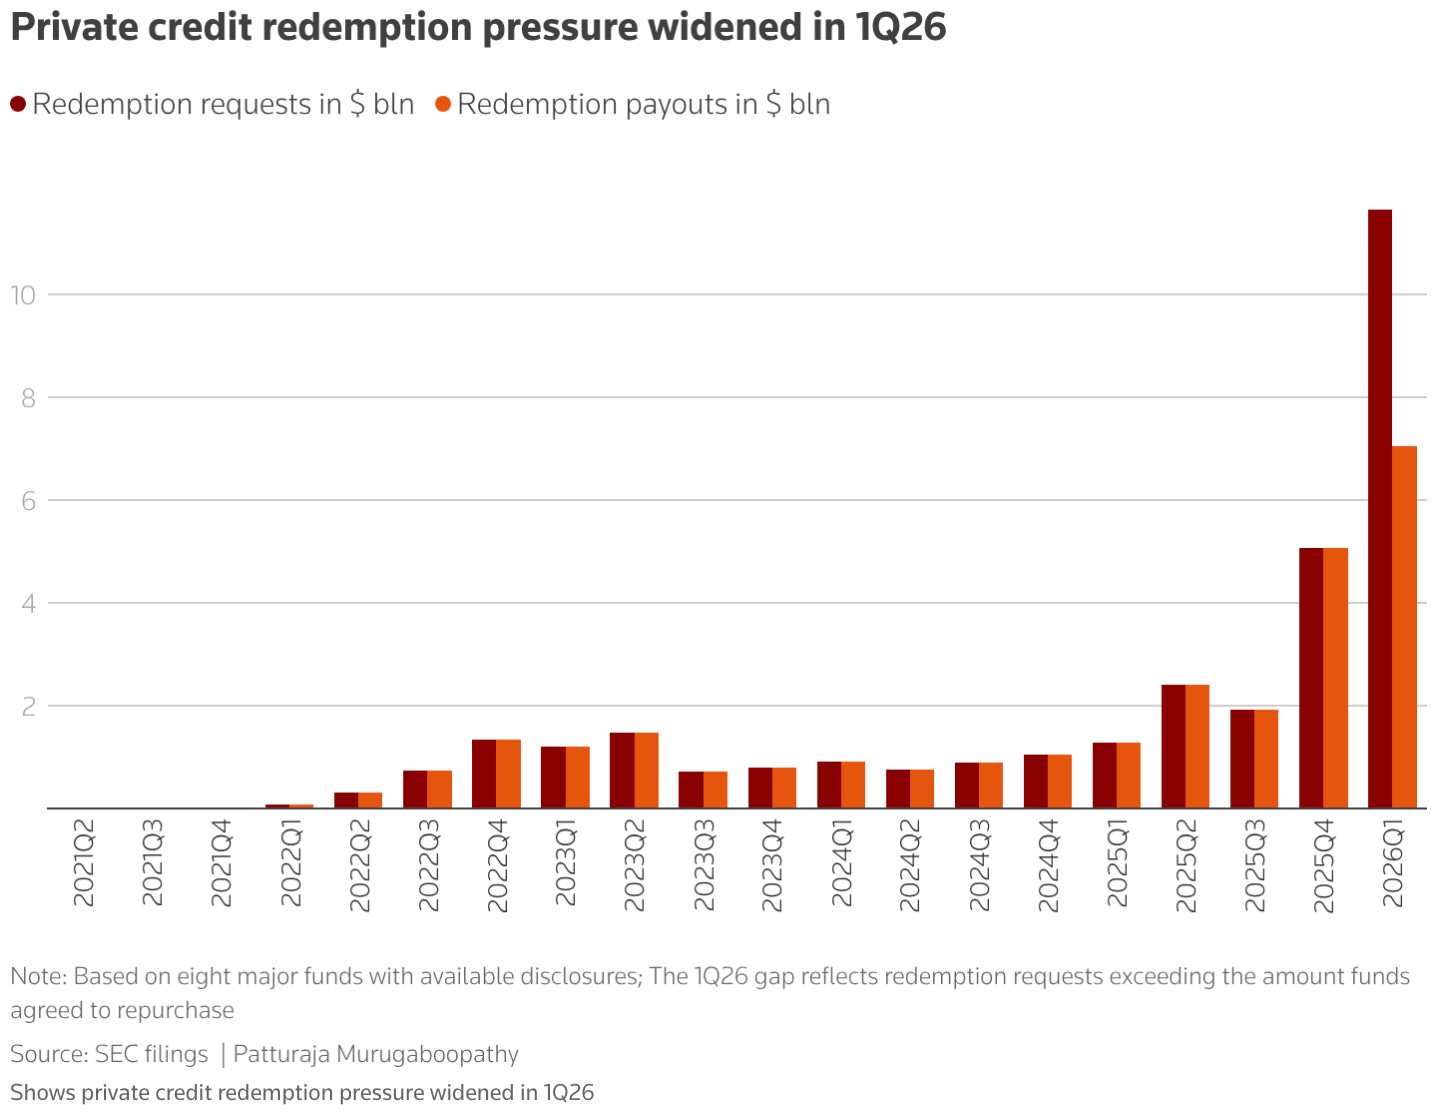
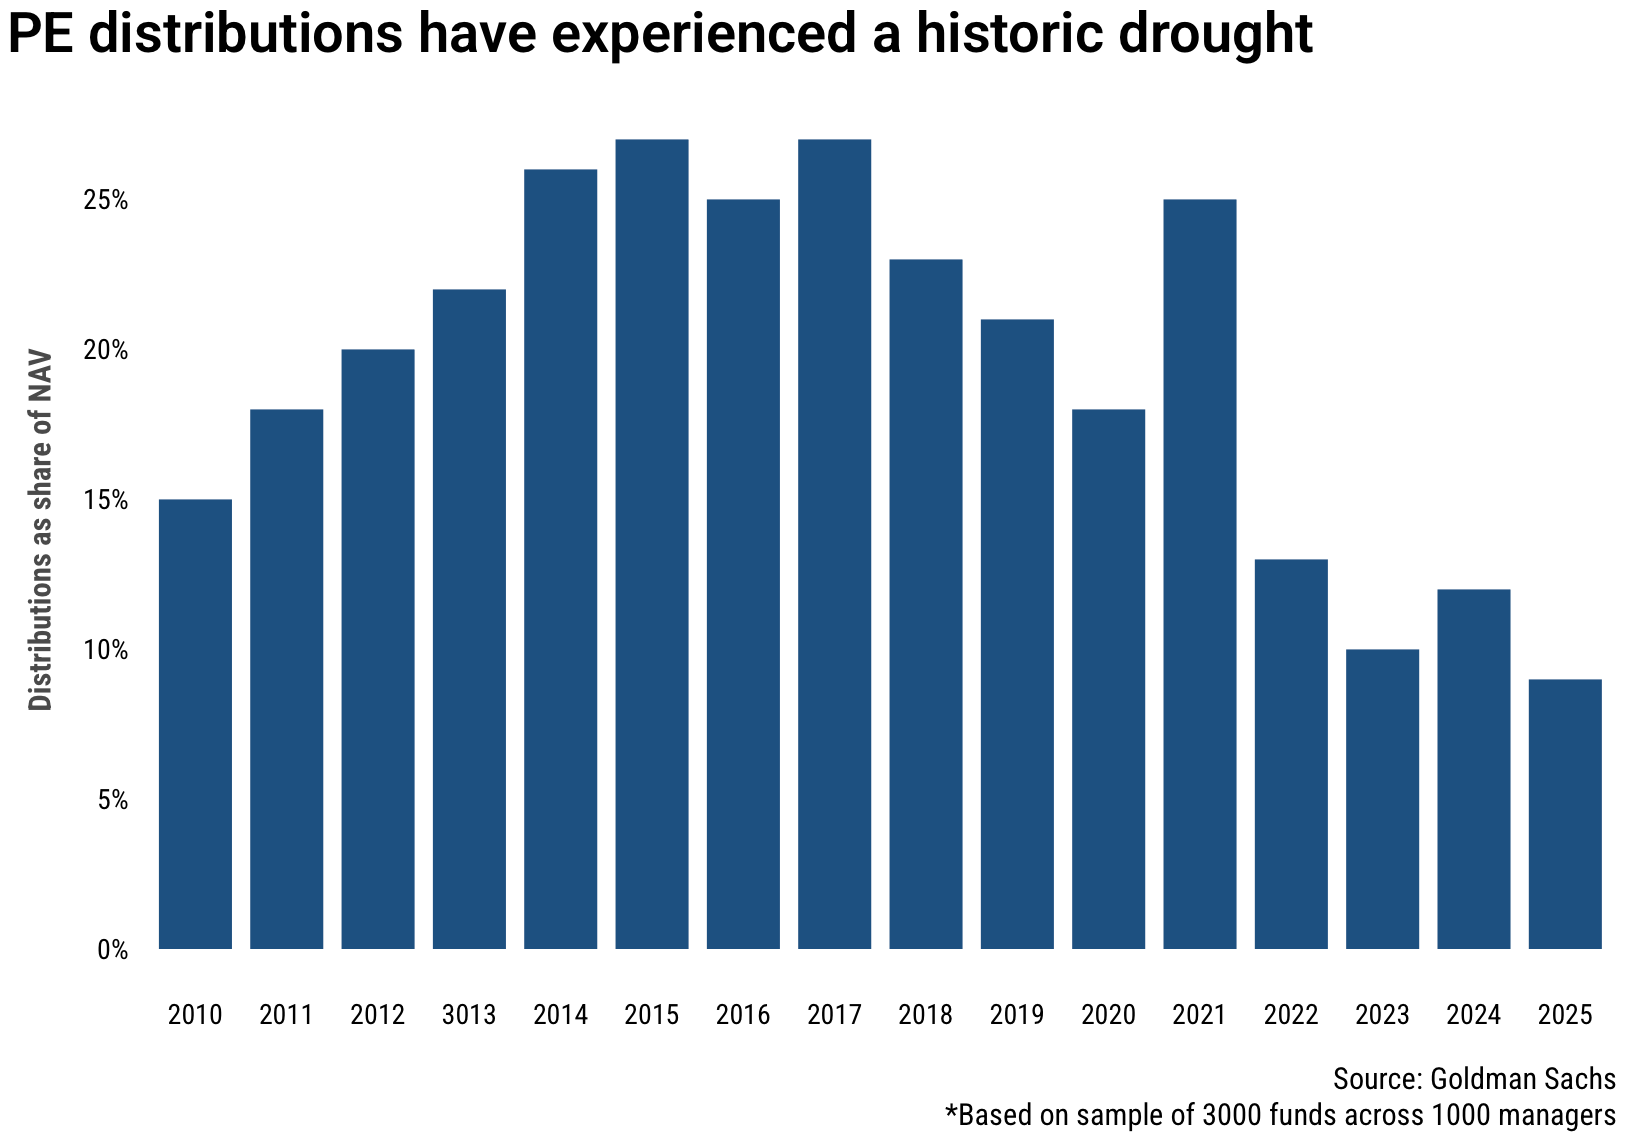
The problems are also prevalent across private equity funds, where distributions fell to their lowest levels as a percentage of NAV since 2010 and well below the long-term 20%–25% average.

The liquidity problems in this corner of the market continue to stack up and there is no foreseeable catalyst that will put an end to this negative trend.

Bitcoin weakness is not done yet.
This is a bold statement to make considering the bear market BTC is in, but we having been calling the local tops and bottoms pretty well over the last few months I am okay making it.
Quinn Thompson@qthomp
 Quinn Thompson @qthompWhat if SOLBTC is the new ETHBTC?1:13 PM · Jun 4, 2026 · 11.1K Views4 Replies · 28 Likes
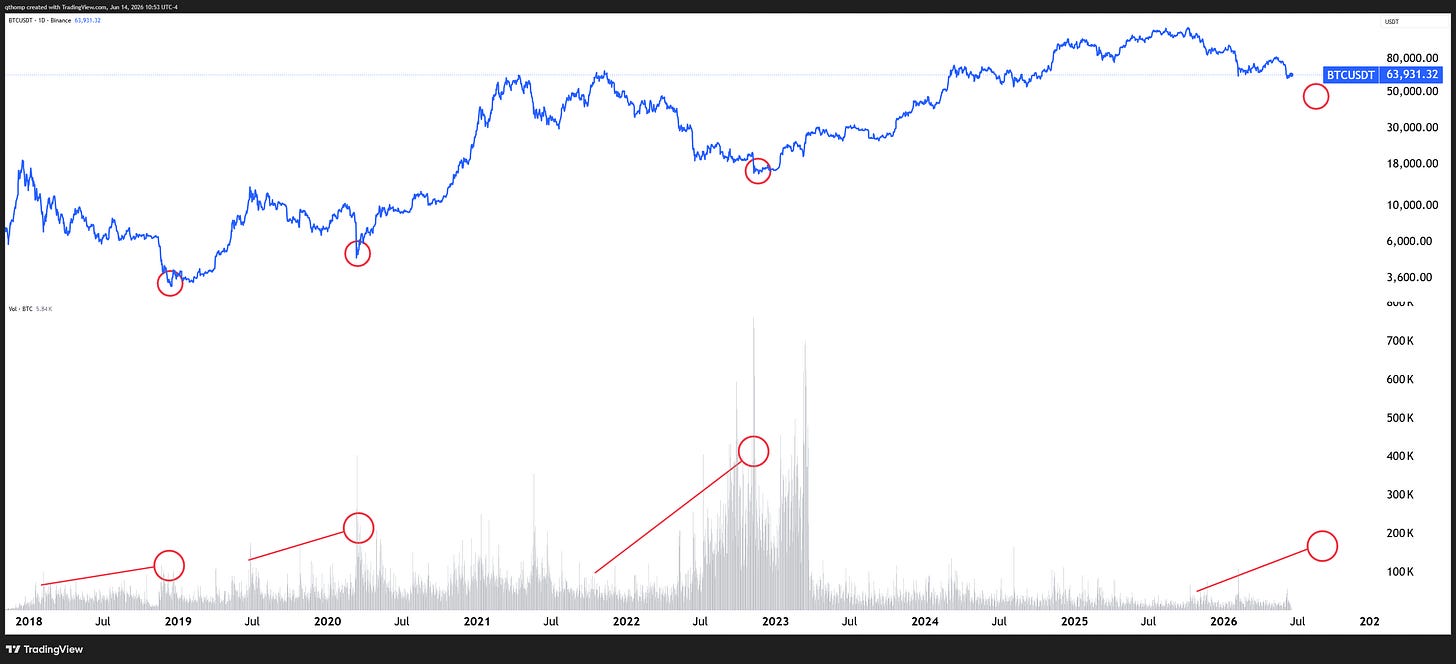
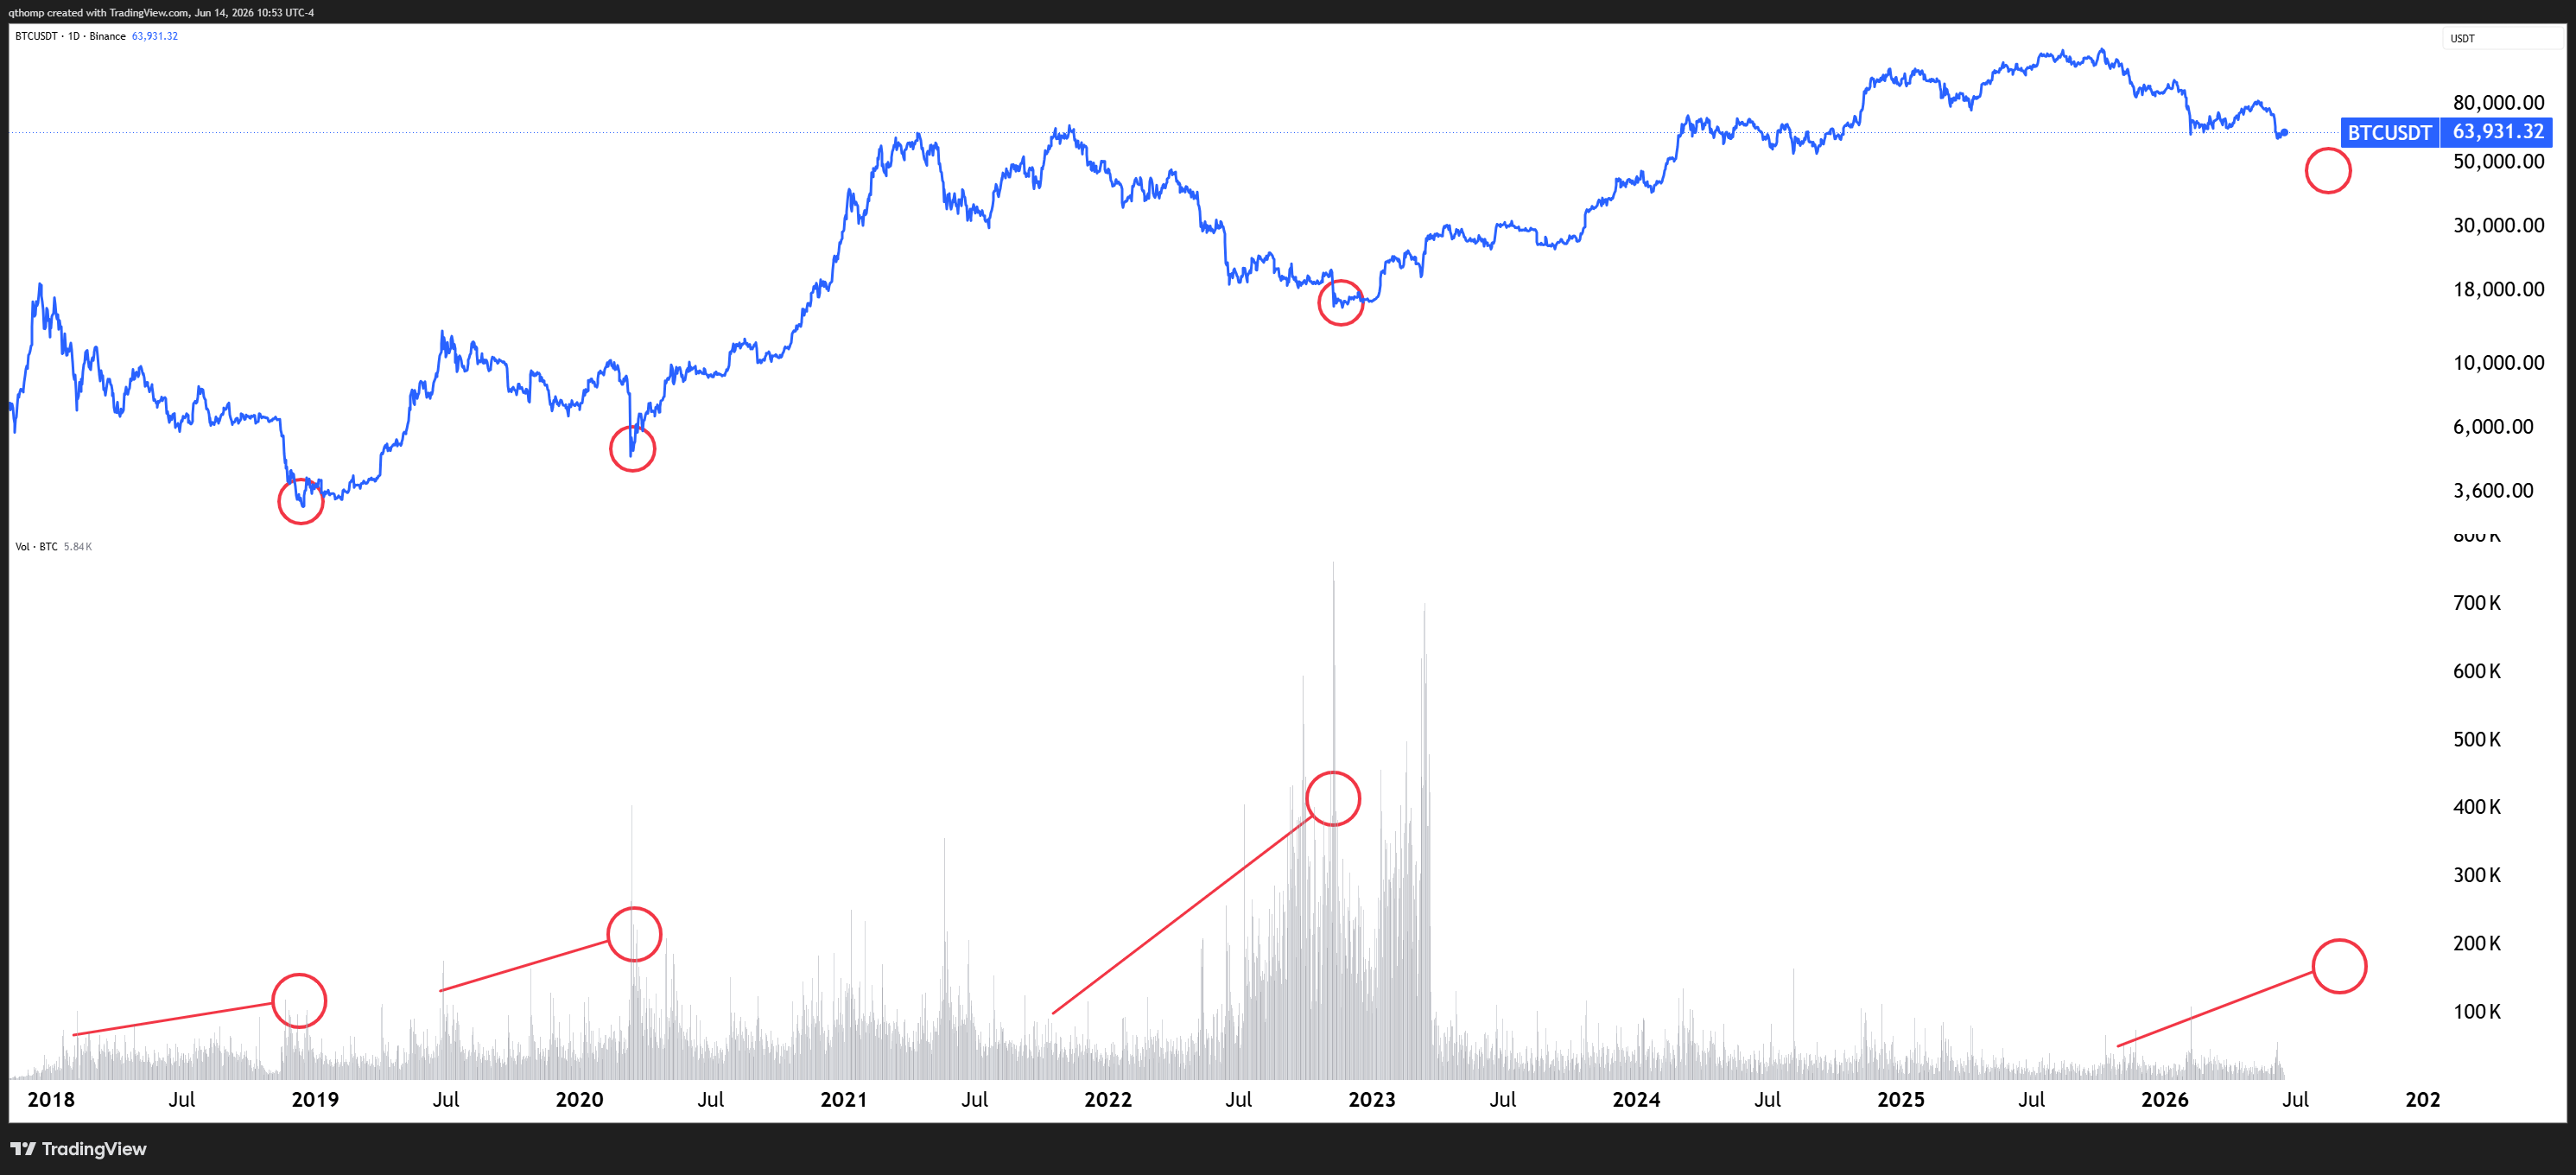
The drawdown is not over and the big capitulation has not arrived. The volume characteristics compared to previous bear markets also don’t support it.
I don’t mean to sound dramatic, but there’s one big headwind for the market that is over 4x the size of FTX at its collapse and currently over 1.5x the size of GBTC’s peak AUM. That is Saylor and Strategy.
The longer that Strategy doesn’t rectify its over-levered balance sheet, the longer the problems will plague the crypto market.
Quinn Thompson@qthomp$STRC has never traded this low into an ex-dividend date (tomorrow). Highly unlikely a 25 bps dividend rate increase fixes this next month, and maybe not even +50 bps at this pace. Meanwhile the hubris has not been dented. Pain can only end when the orange dot tweets do.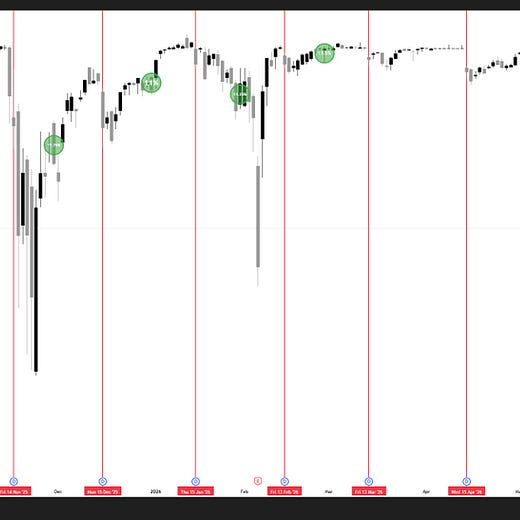
 Quinn Thompson @qthomp“Steady”…not sure the market agrees but let’s see. For the month of June it appears Strategy will be prioritizing MSTR owners over STRC owners. https://t.co/XJJ2yHOIda2:28 PM · Jun 14, 2026 · 1.32K Views2 Replies · 1 Repost · 16 Likes
There is blood in the water but no bodies have surfaced yet. In fact he continues to make the problem worse.
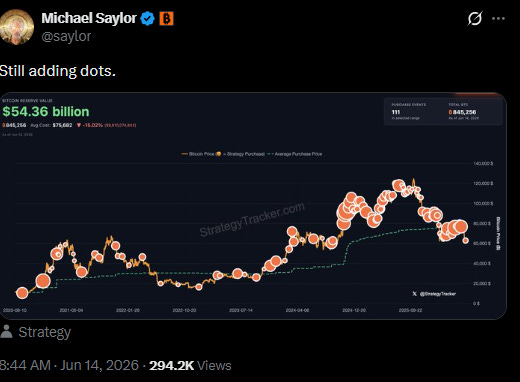
Quinn Thompson@qthompAbsolutely mind boggling that @Strategy is still levering up. They're selling $MSTR shares that are worth 80 cents on the dollar to buy $1 dollar bills. Relative to its BTC holdings after accounting for debt and preferred equity liabilities, MSTR common trades at ~0.8x NAV. ThisMichael Saylor @saylorStill adding dots.3:04 PM · Jun 14, 2026 · 102 Views1 Reply · 1 LikeWhen an over-levered company sees their balance sheet flipped upside down, it is extremely rare that time solves the problem. What solves the problem is cleaning it up and de-levering and getting back to working from a position of strength.
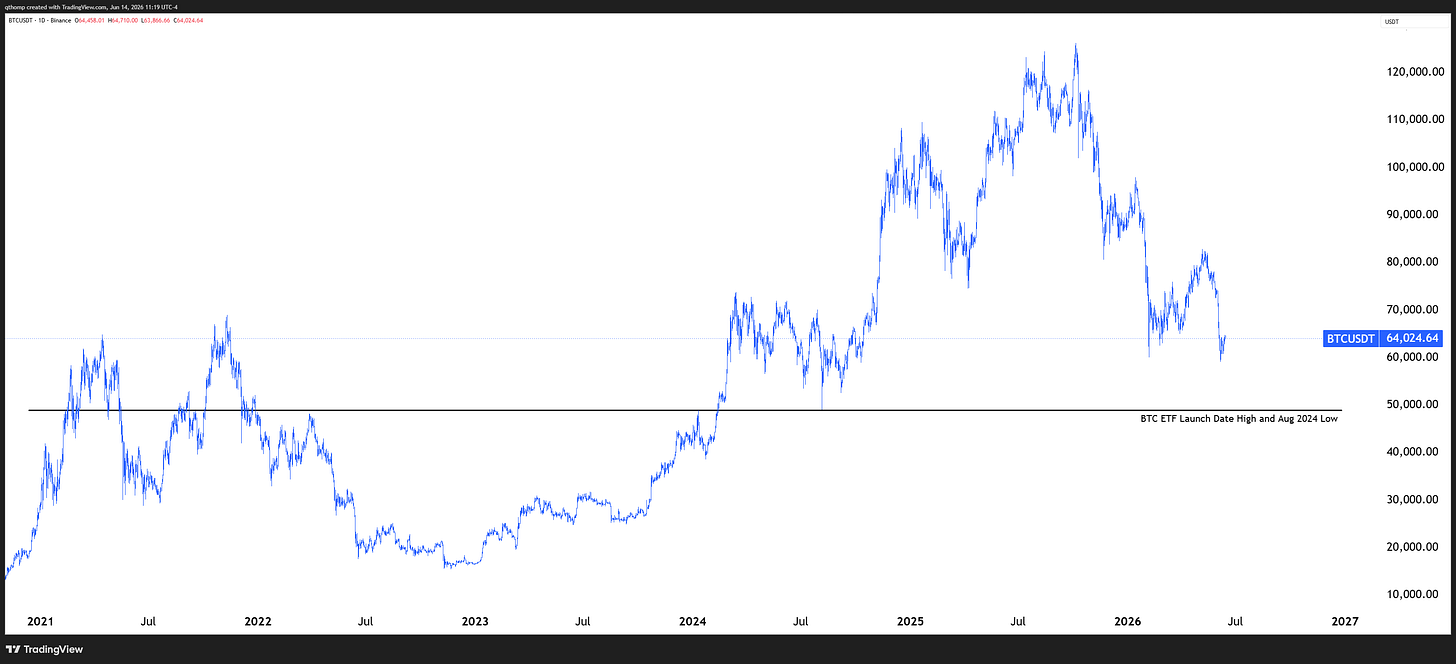
If I were to guess what a Bitcoin bottom looks like, it would be a larger capitulation event that forces Strategy to raise an additional ~$3B in cash that covers its next few years of debt maturities and rebuilds its debt service and preferred equity dividend cash reserve.
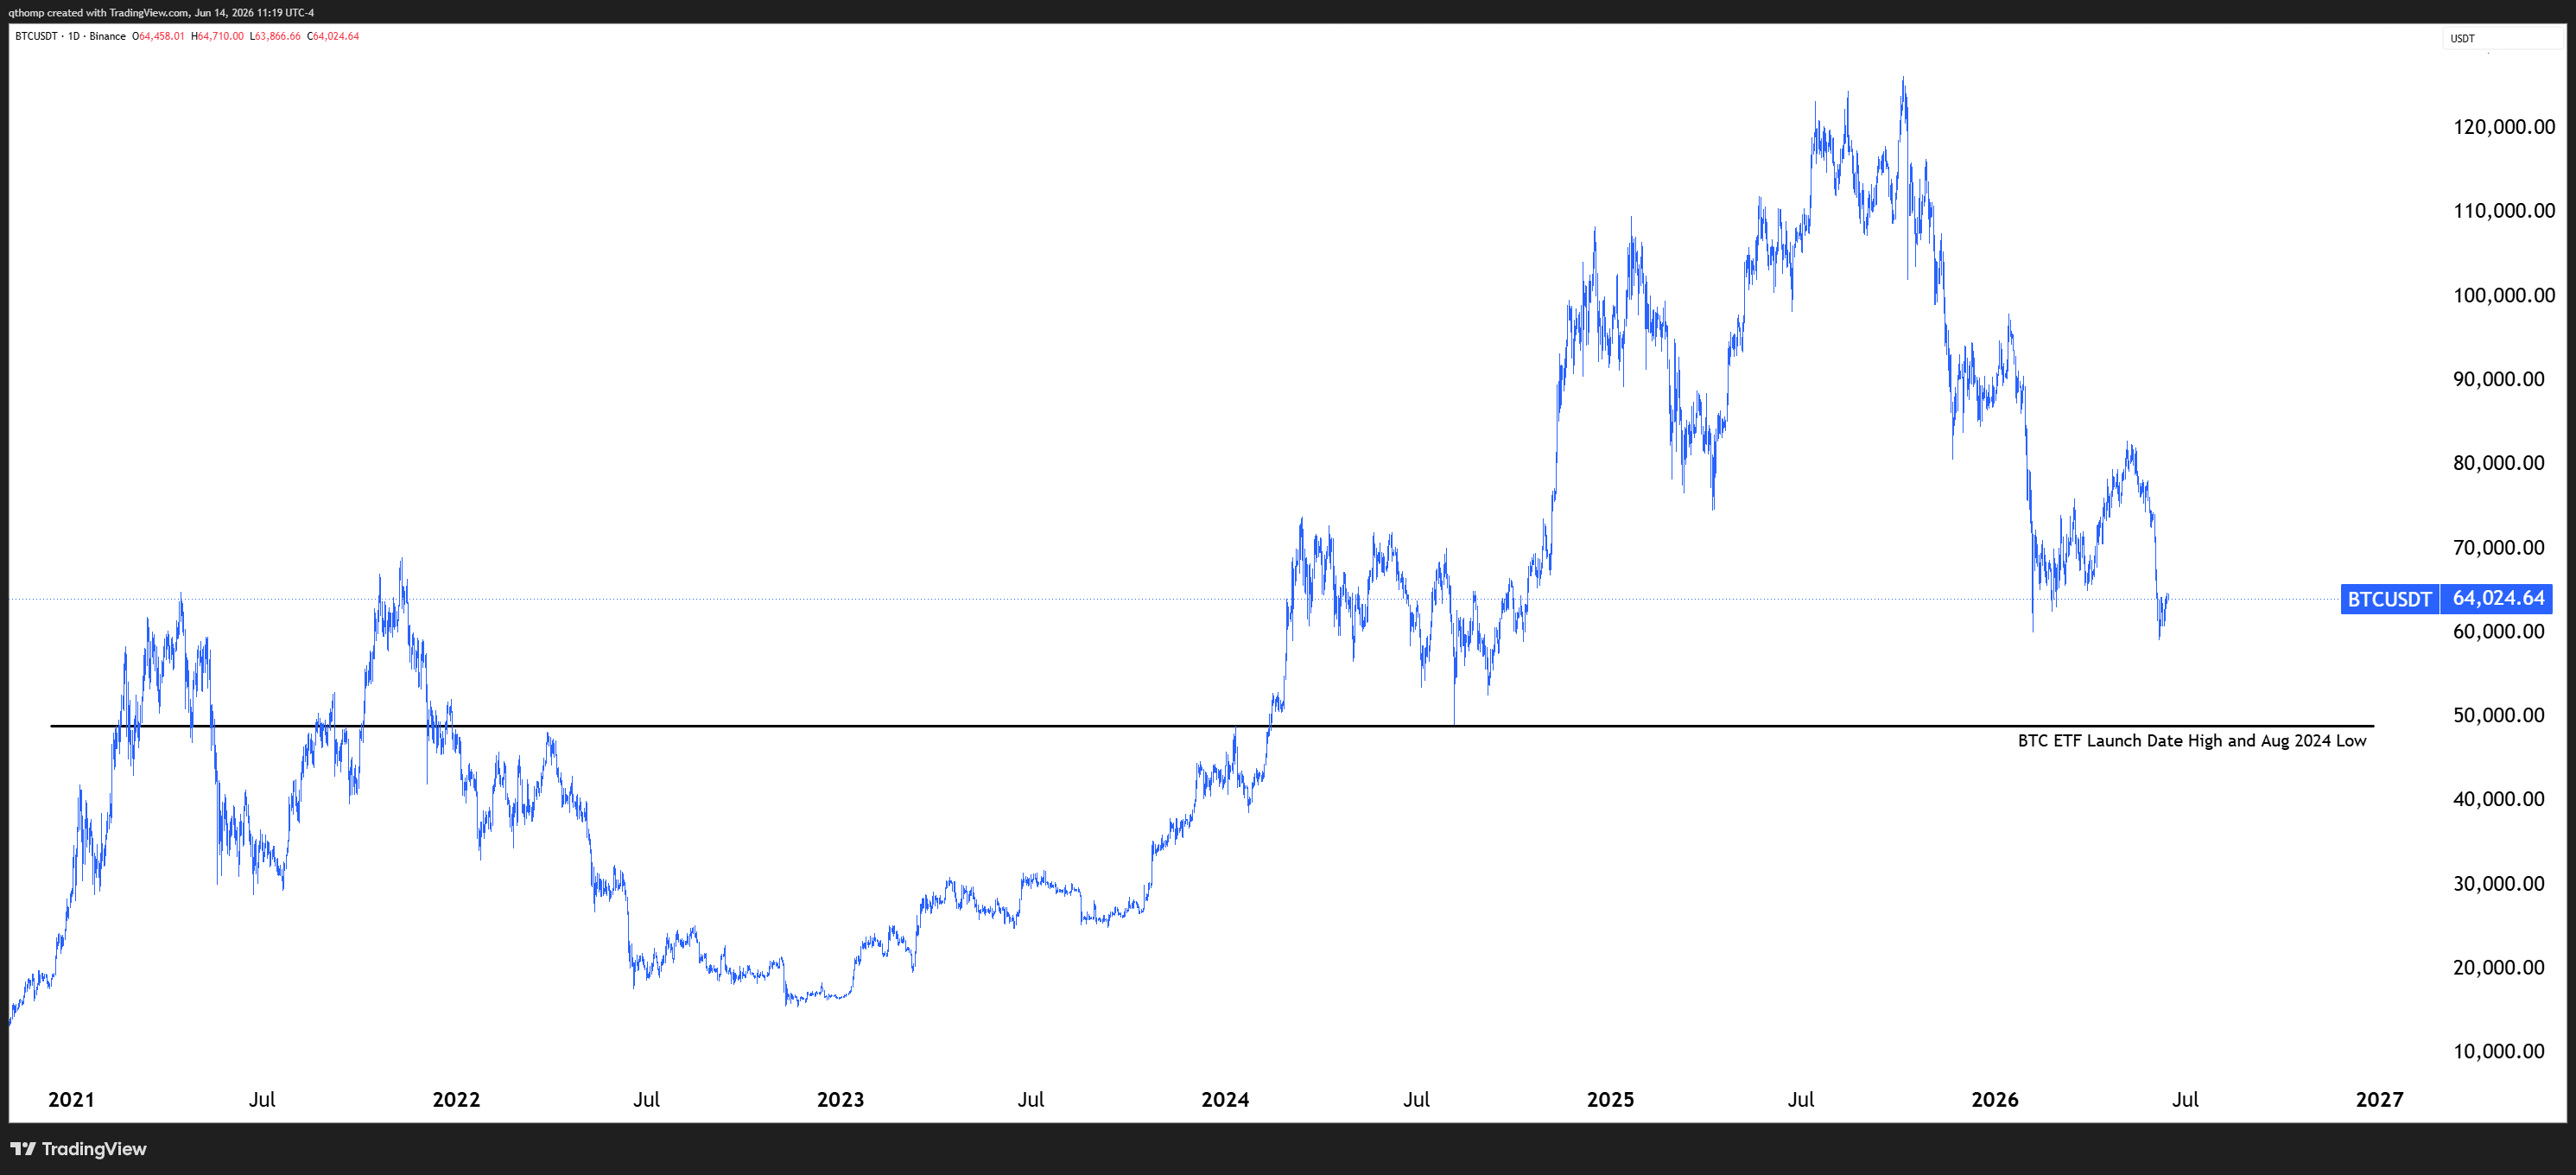
Maybe the market wants to flush the January 2024 Bitcoin ETF launch date highs and August 2024 Yen carry unwind lows around $49,000? That would also make the symmetry of the chart pretty nice optically speaking.
Let me paint a very plausible situation to make it clear what I mean. Strategy’s capital structure today is ~$5.7B of net debt and ~$15.5B of preferred equity, for a total of just over ~$21B combined. They currently hold ~845,000 BTC that at a $50,000 price per Bitcoin would equal ~$42B in value. Subtracting the $21B of net securities and obligations senior to common equity you arrive at ~$21B in value to MSTR holders. At a 1:1 value of BTC to market cap, that comes out to ~$59 per share (based on ~354 million basic shares outstanding). MSTR trades above $120 today.
I have to commend Saylor’s ability to steer the narrative to have everyone focused on faulty metrics that have retail investors convinced that equity is equal to assets plus liabilities. Some might even call it a crime. But now that he is losing credibility more quickly, first after lying about at what mNAV levels he will issue common equity last year to now lying about never selling Bitcoin, sentiment is changing enough to probably also start making MSTR holders question what they really own. And the truth even today at $64,000 Bitcoin prices ($54B in BTC holdings) and their $21B in net debt plus preferred equity, MSTR liquidation value sits at ~$93 per share. This is why he is still selling it to buy more Bitcoin. I can understand the still selling MSTR part but disagree with his use of proceeds - he should be accumulating cash reserves instead.


Lots going on in markets and a big week ahead with BOJ and FOMC meetings during a US holiday shortened week. I think the back half of June is particularly dangerous for risk assets. Good luck out there.

Great analysis. Thanks 🙏🏼
The gold long case is very strong here:
- Positioning at multi year levels of defensiveness
- Start of war topped it , end of war bottom
- H2 Midterm years usually bode well for it
The only thing that is worrying me is how it is still trading in lock step with risk in general just worse